W. E. B. Du Bois’ visionary infographics

Sarah Handelman

One of 58 charts and graphs compiled for the ‘American Negro’ display at the Exposition universelle
William Edward Burghardt Du Bois (1868–1963), One of 58 charts and graphs compiled for the ‘American Negro’ display at the Exposition Universelle, Paris, 1900. Ink and watercolour, 710 × 560 mm. Library of Congress.

In 1900 W.E.B. Du Bois travelled to the Exposition Universelle in Paris to present the ‘American Negro’, an exhibition that sought ‘to give, in as systematic and compact a form as possible, the history and present condition of a large group of human beings’. In addition to Du Bois, then a professor of sociology at Atlanta University, the all-black curatorial team comprised Daniel A P Murray, a researcher and historian at the Library of Congress, Booker T Washington and Thomas J Calloway. Working in collaboration with nearly two-dozen institutions and universities, they presented 200 volumes by African American authors, ‘a record of 350 patents granted to black men since 1834’, and 500 photographs of African Americans as well as black-owned businesses, churches and homes – which ‘hardly square with conventional American ideas’, challenged Du Bois.

One of 58 charts and graphs compiled for the ‘American Negro’ display at the Exposition universelle
William Edward Burghardt Du Bois (1868–1963), One of 58 charts and graphs compiled for the ‘American Negro’ display at the Exposition Universelle, Paris, 1900. Ink and watercolour, 710 × 560 mm. Library of Congress.
One of 58 charts and graphs compiled for the ‘American Negro’ display at the Exposition universelle
William Edward Burghardt Du Bois (1868–1963), Paris, 1900–1900. Ink and watercolour, 710 × 560 mm. Library of Congress.
One of 58 charts and graphs compiled for the ‘American Negro’ display at the Exposition universelle
William Edward Burghardt Du Bois (1868–1963), Paris, 1900–1900. Ink and watercolour, 710 × 560 mm. Library of Congress.
One of 58 charts and graphs compiled for the ‘American Negro’ display at the Exposition universelle
William Edward Burghardt Du Bois (1868–1963), Paris, 1900–1900. Ink and watercolour, 710 × 560 mm. Library of Congress.

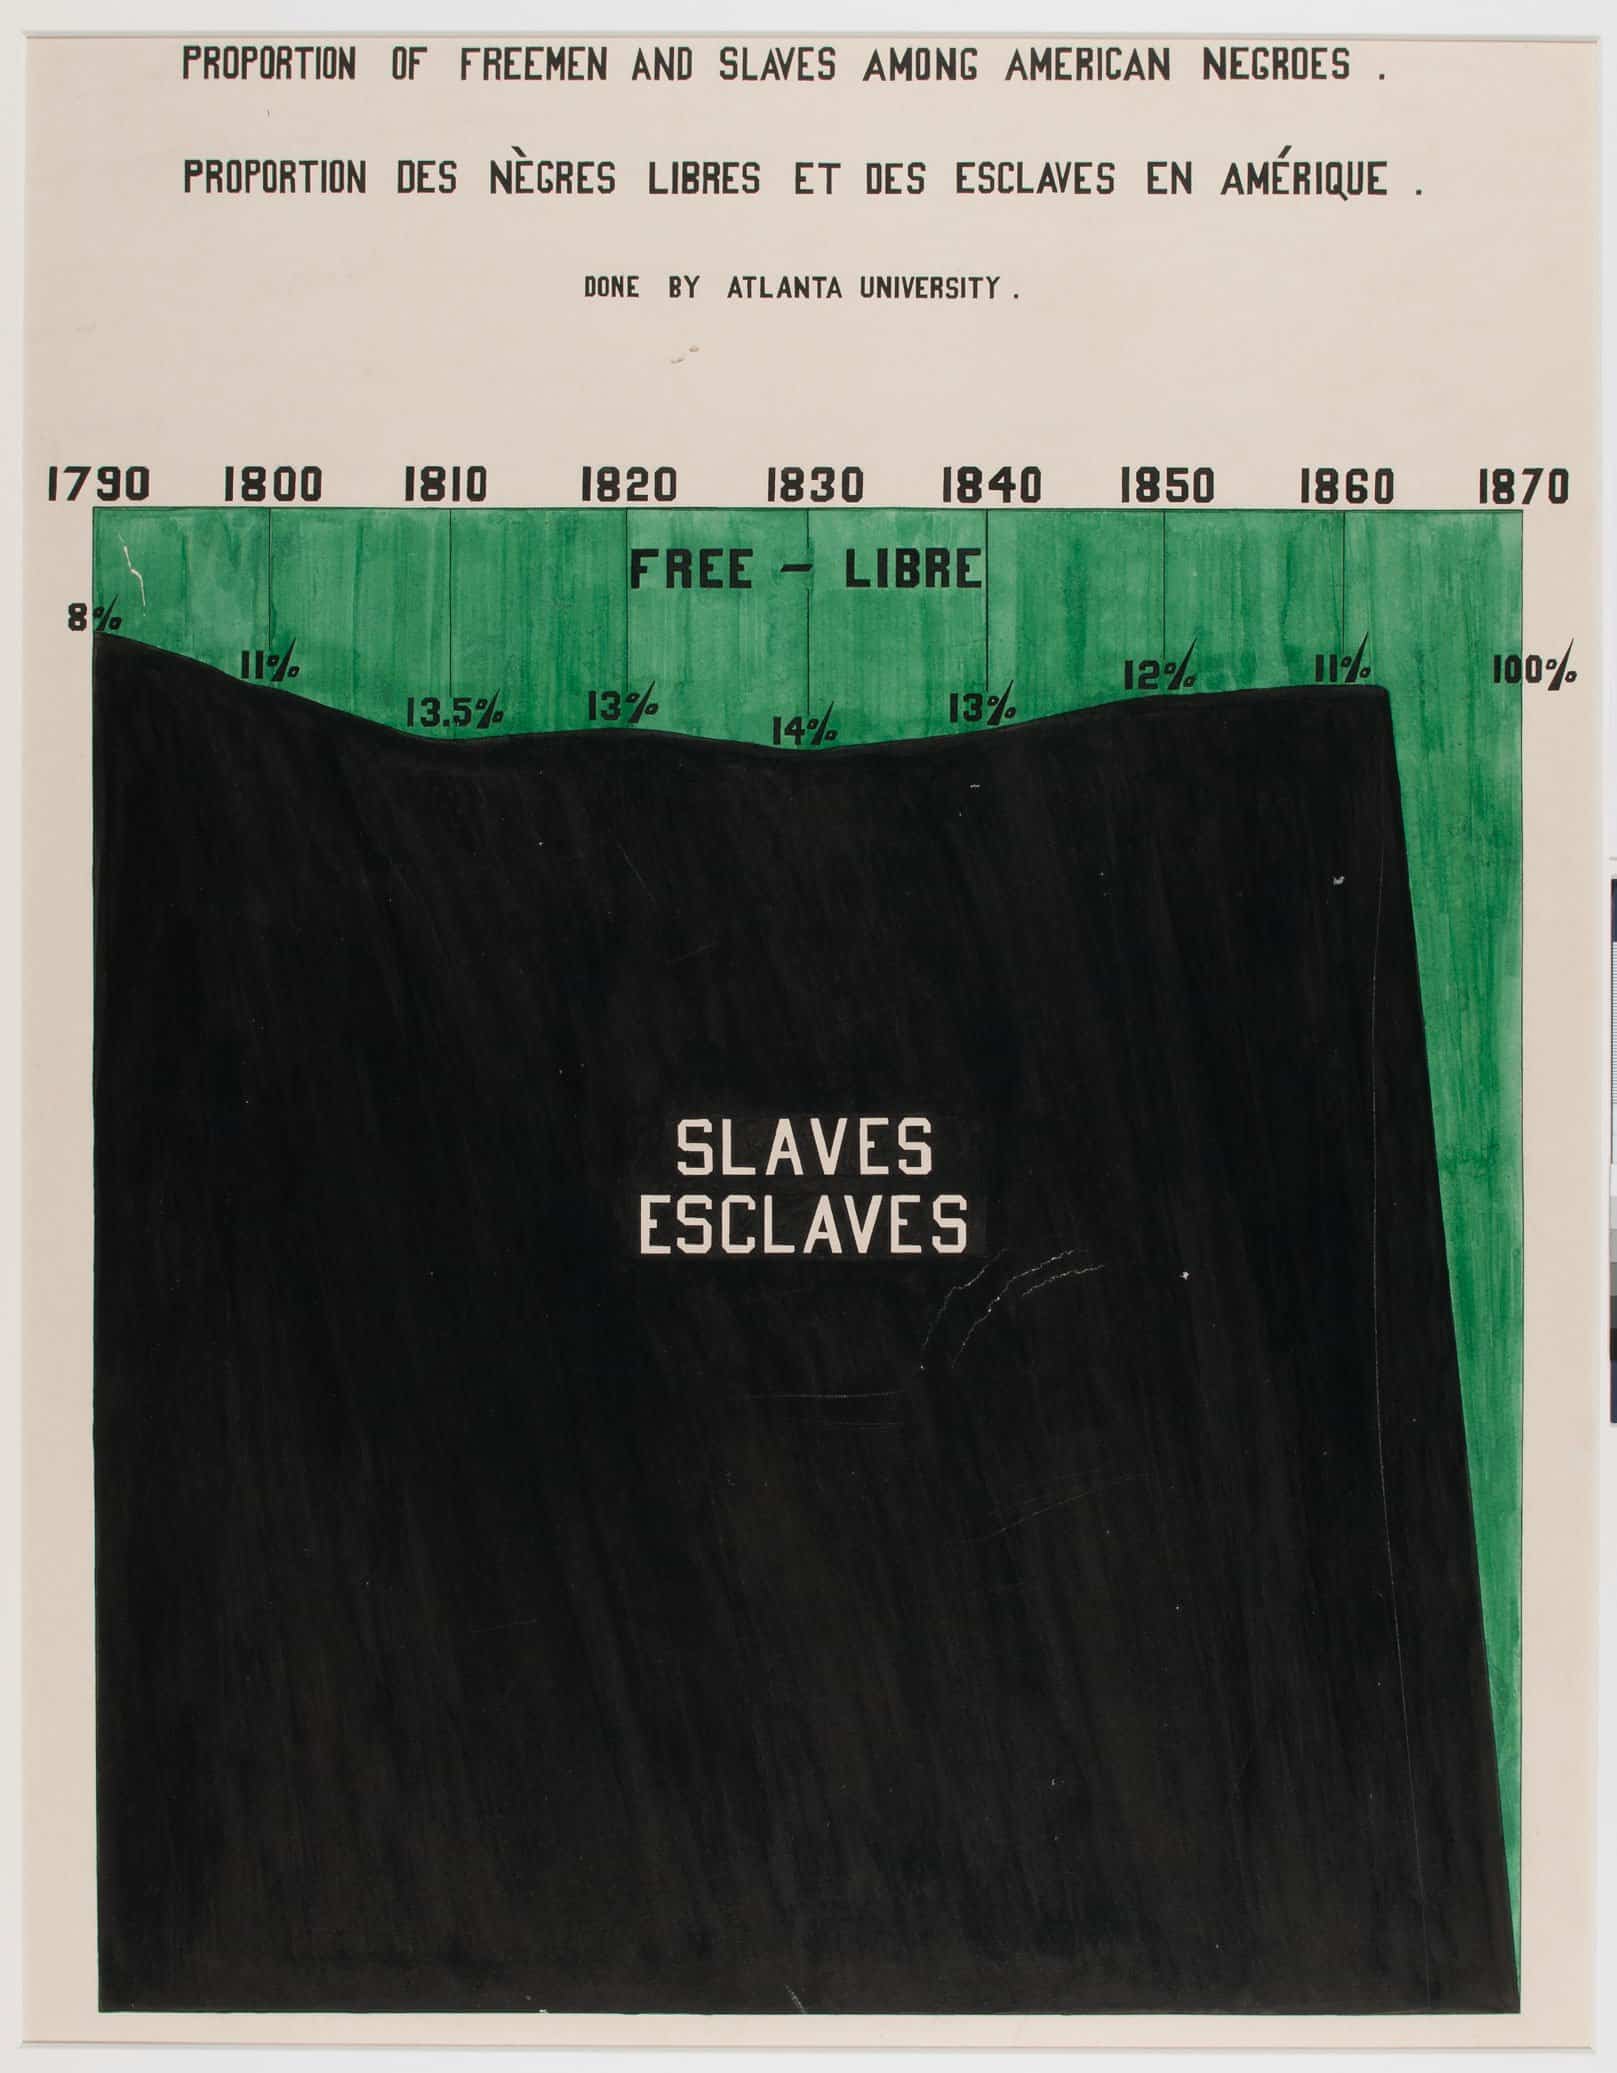
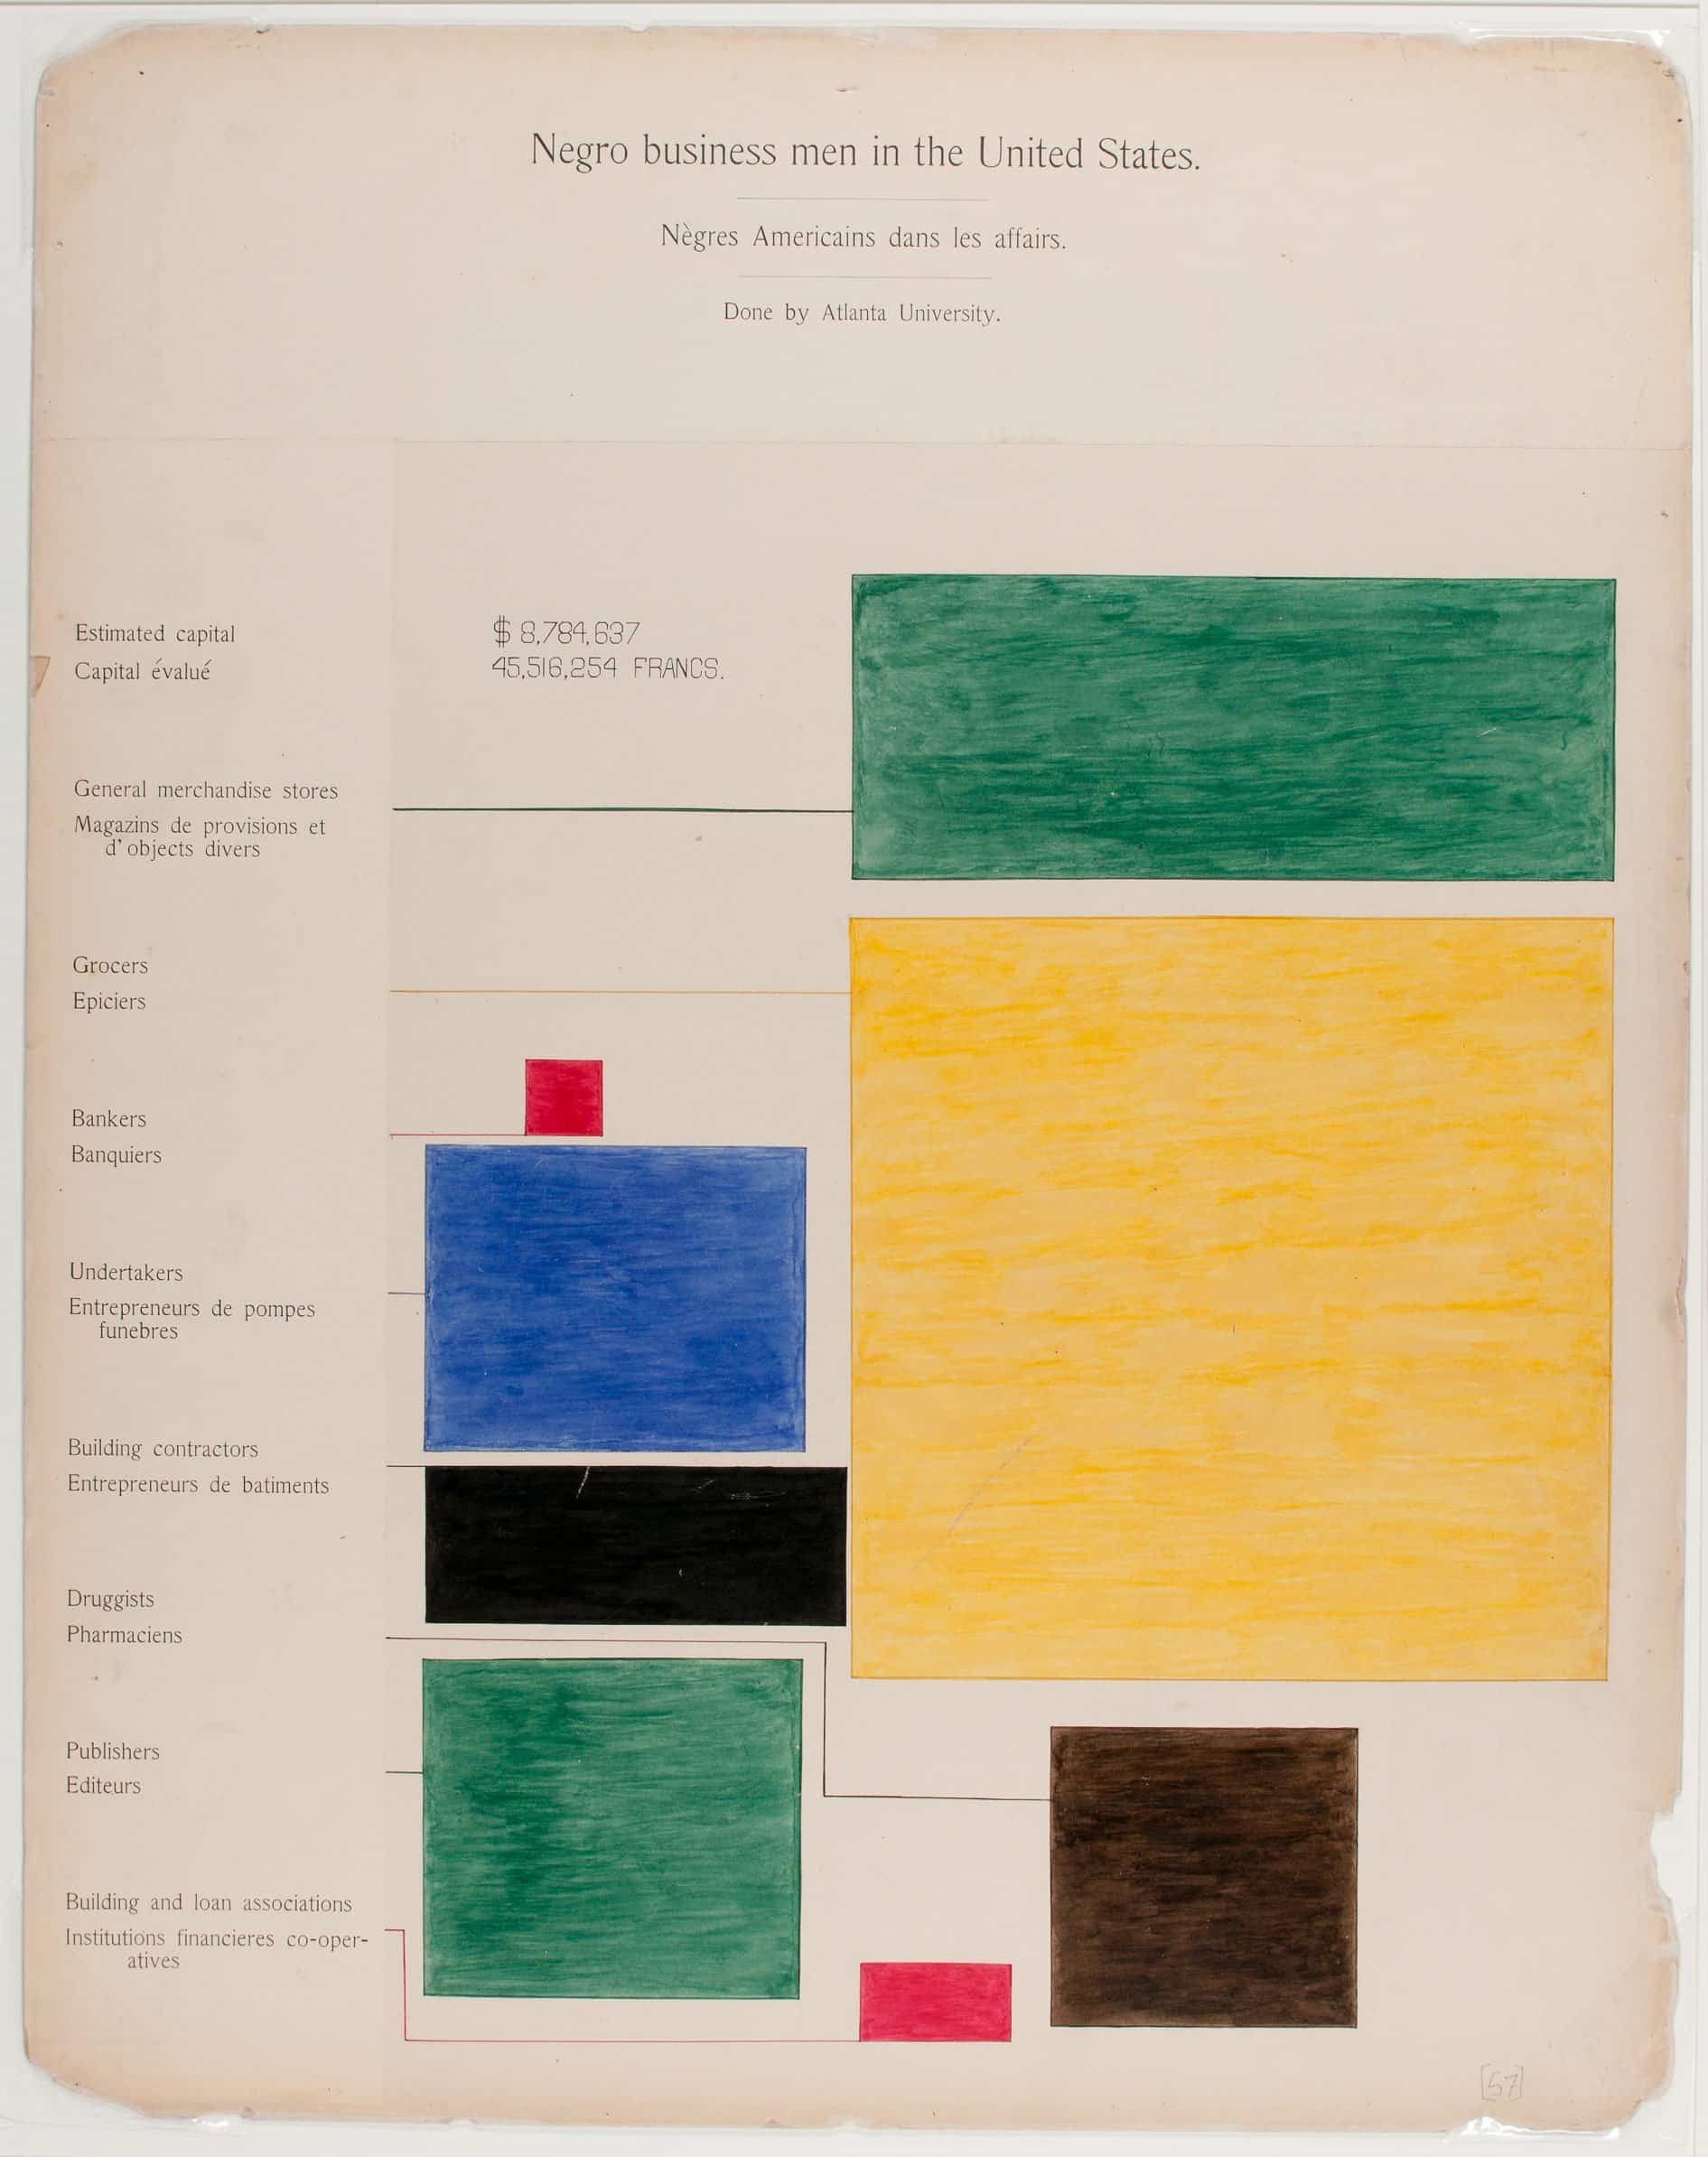
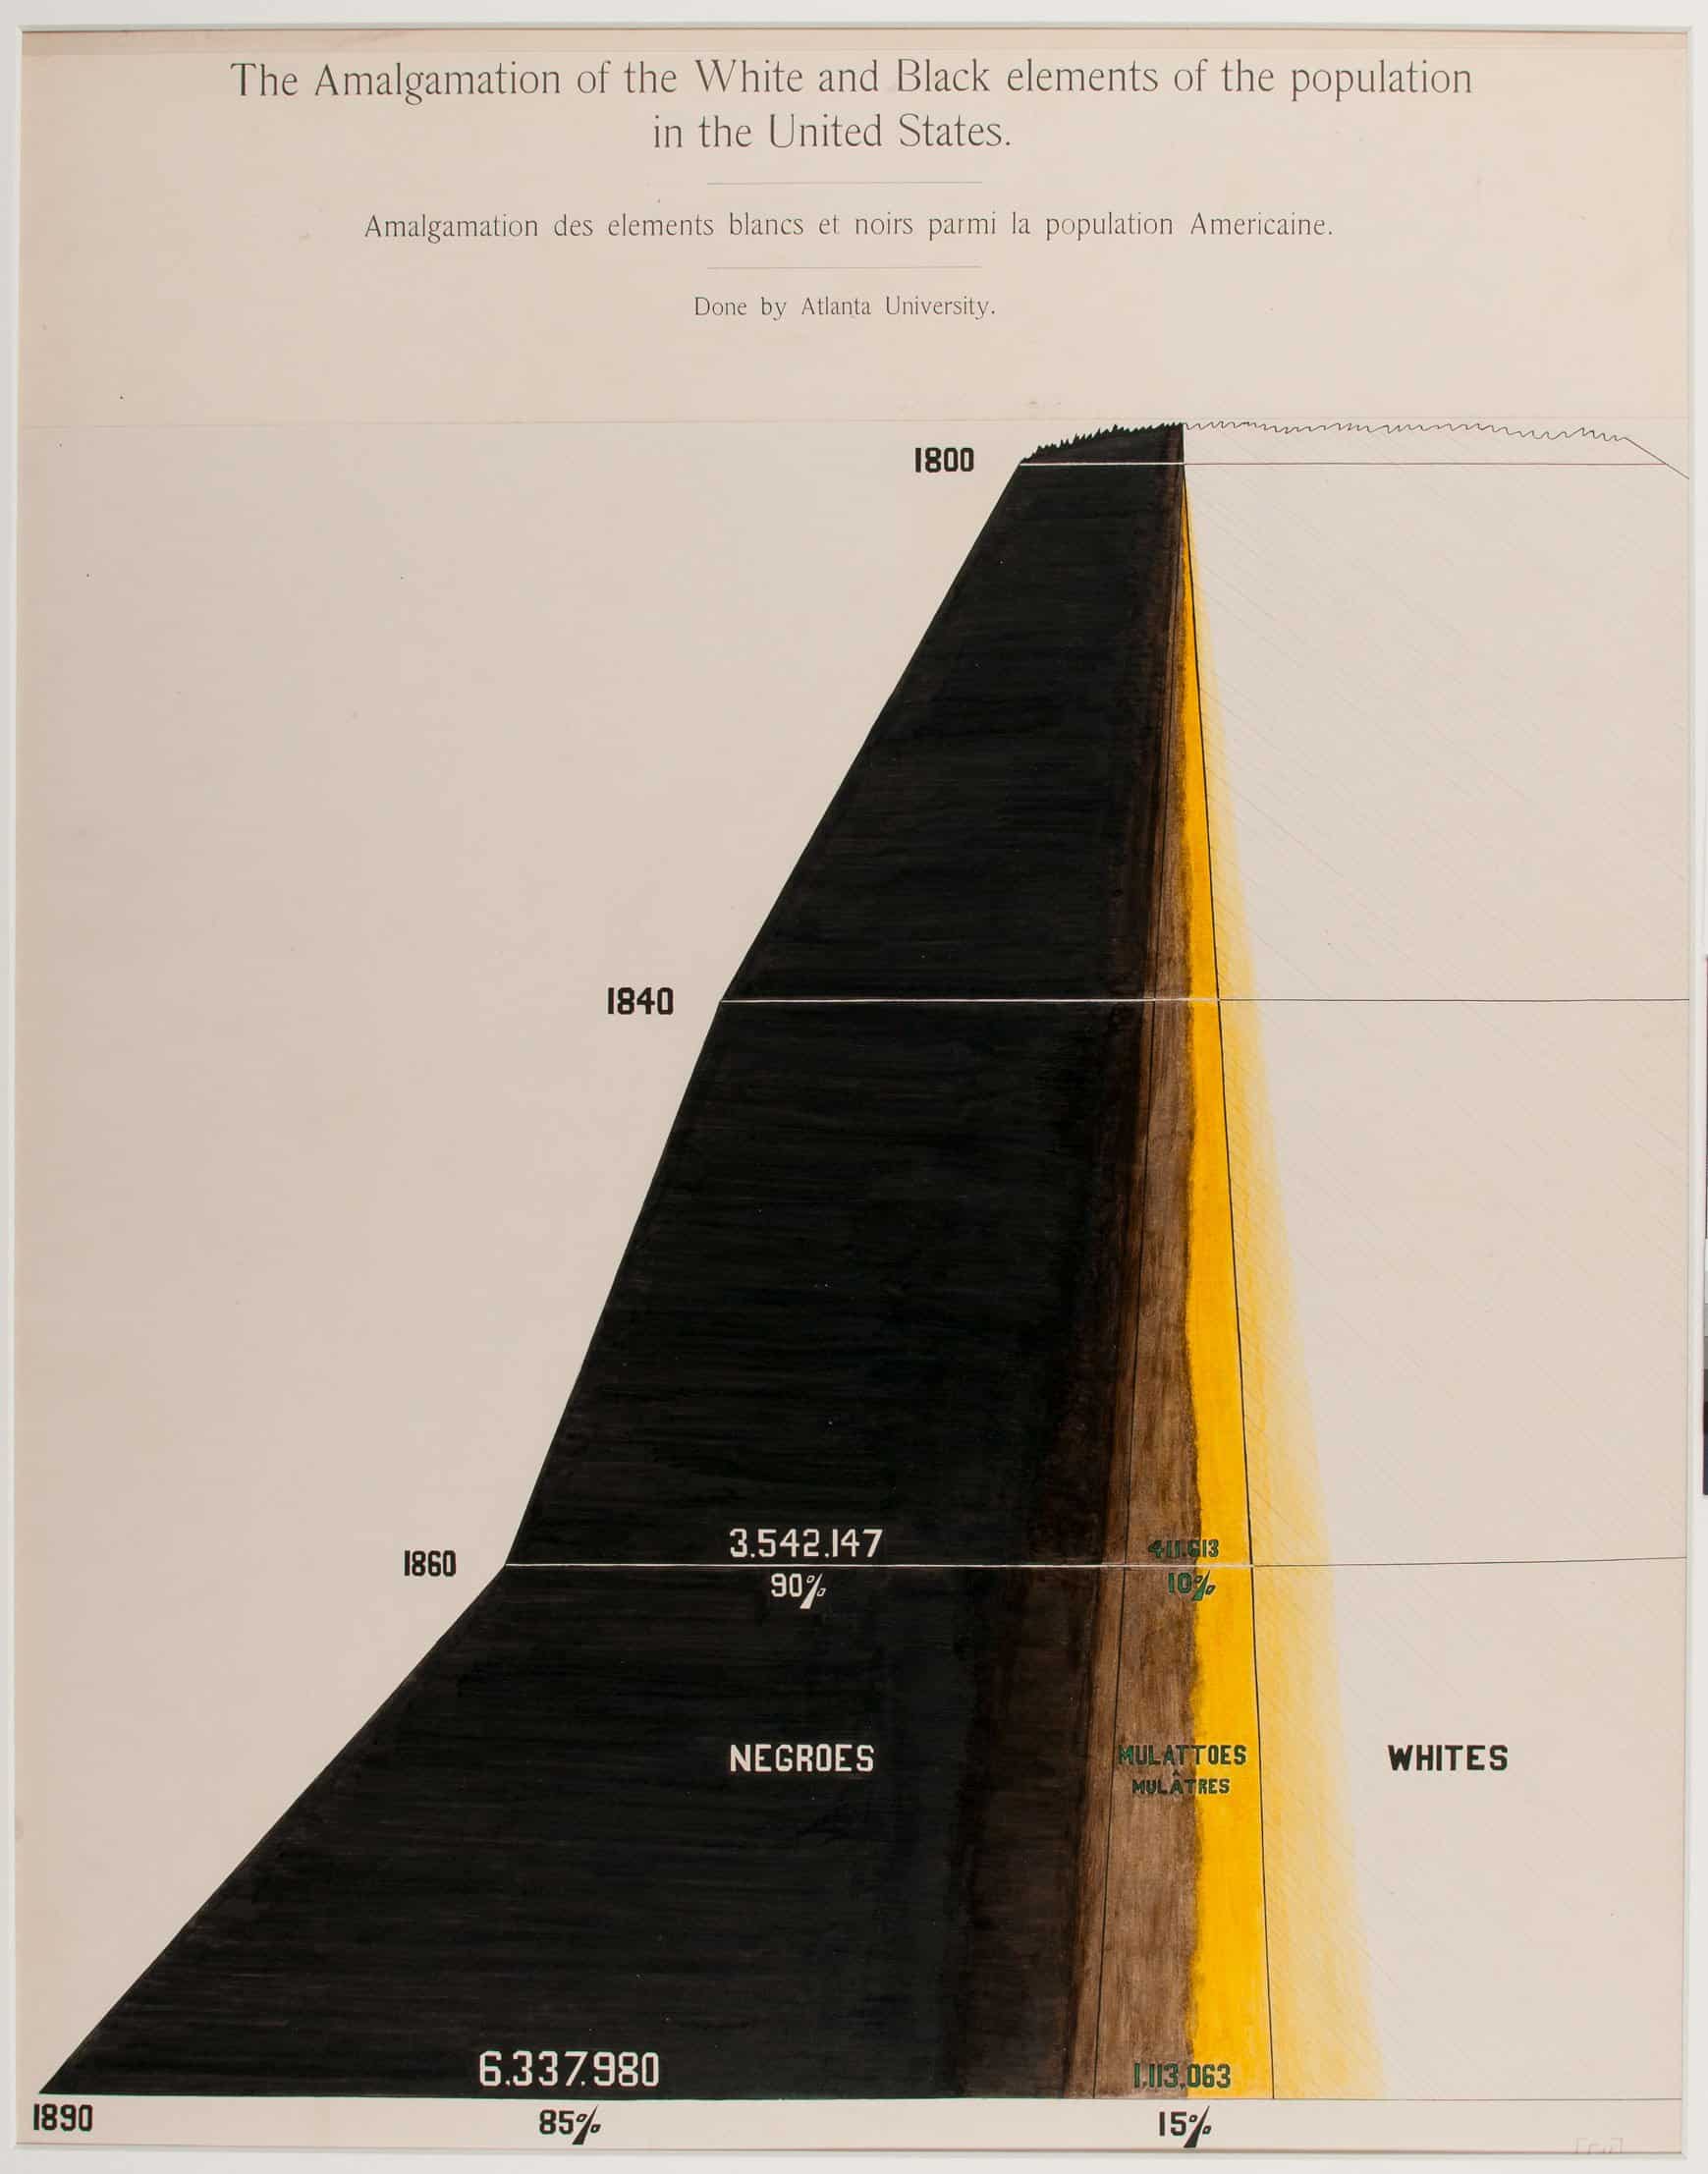
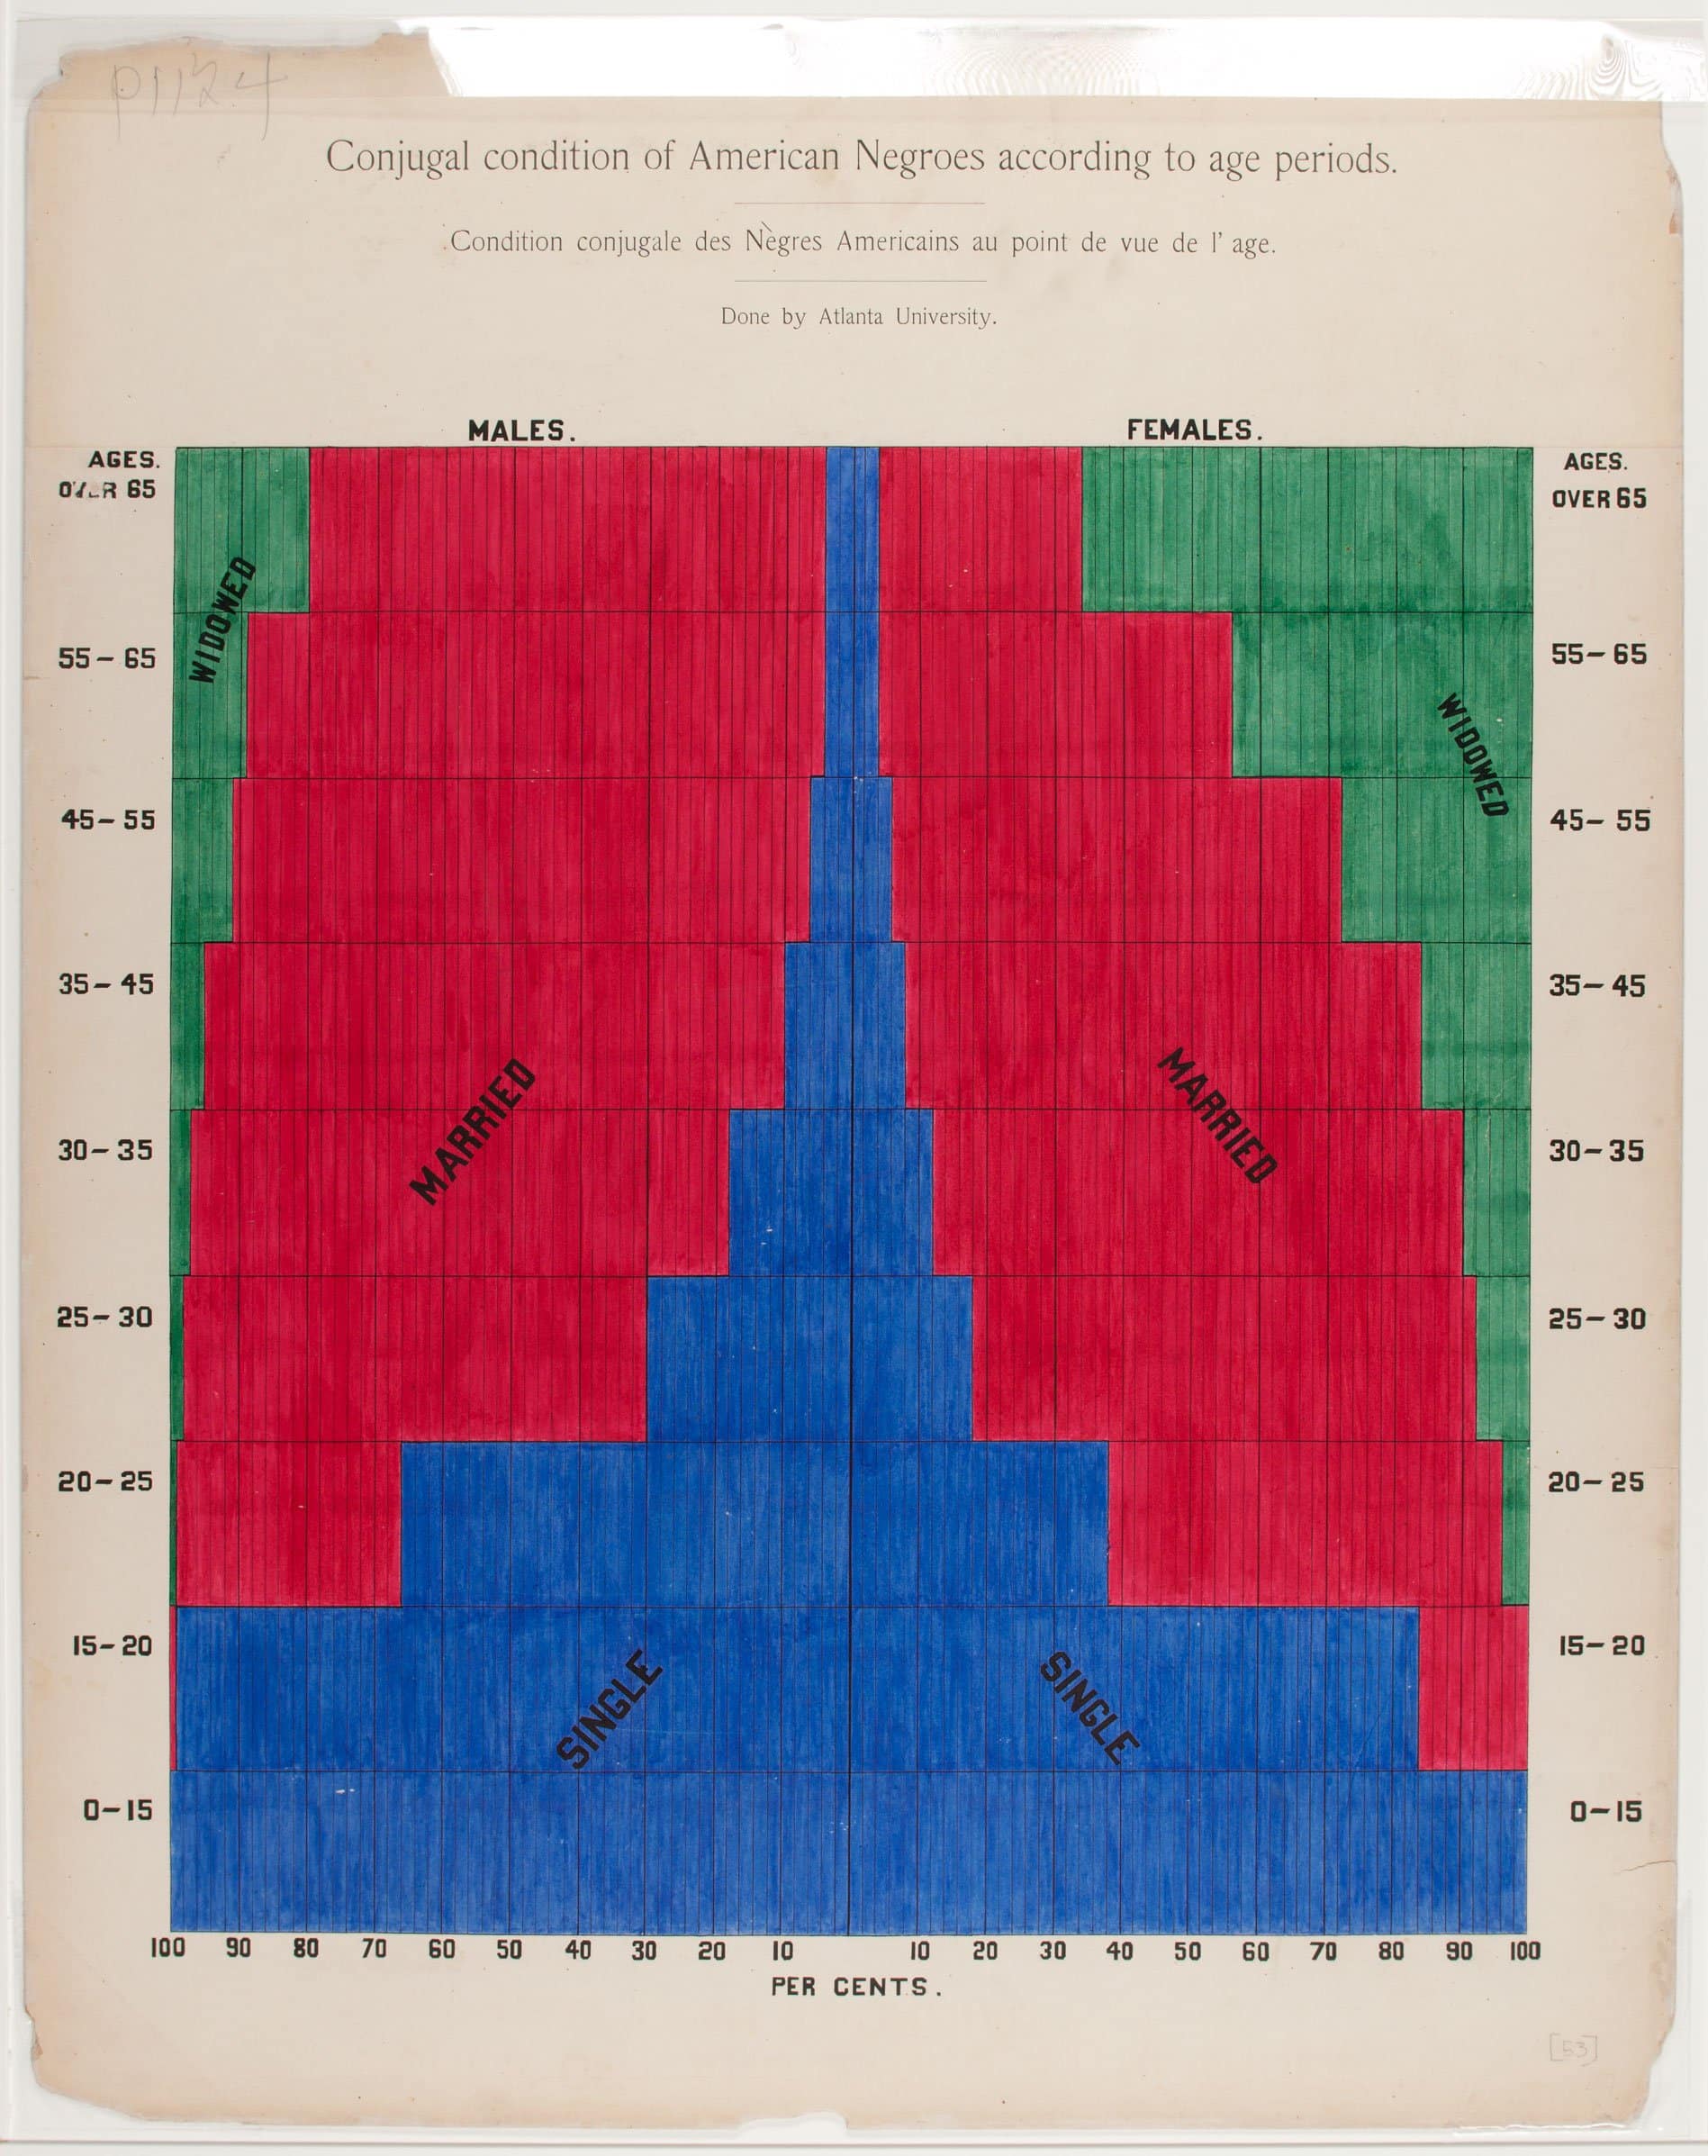
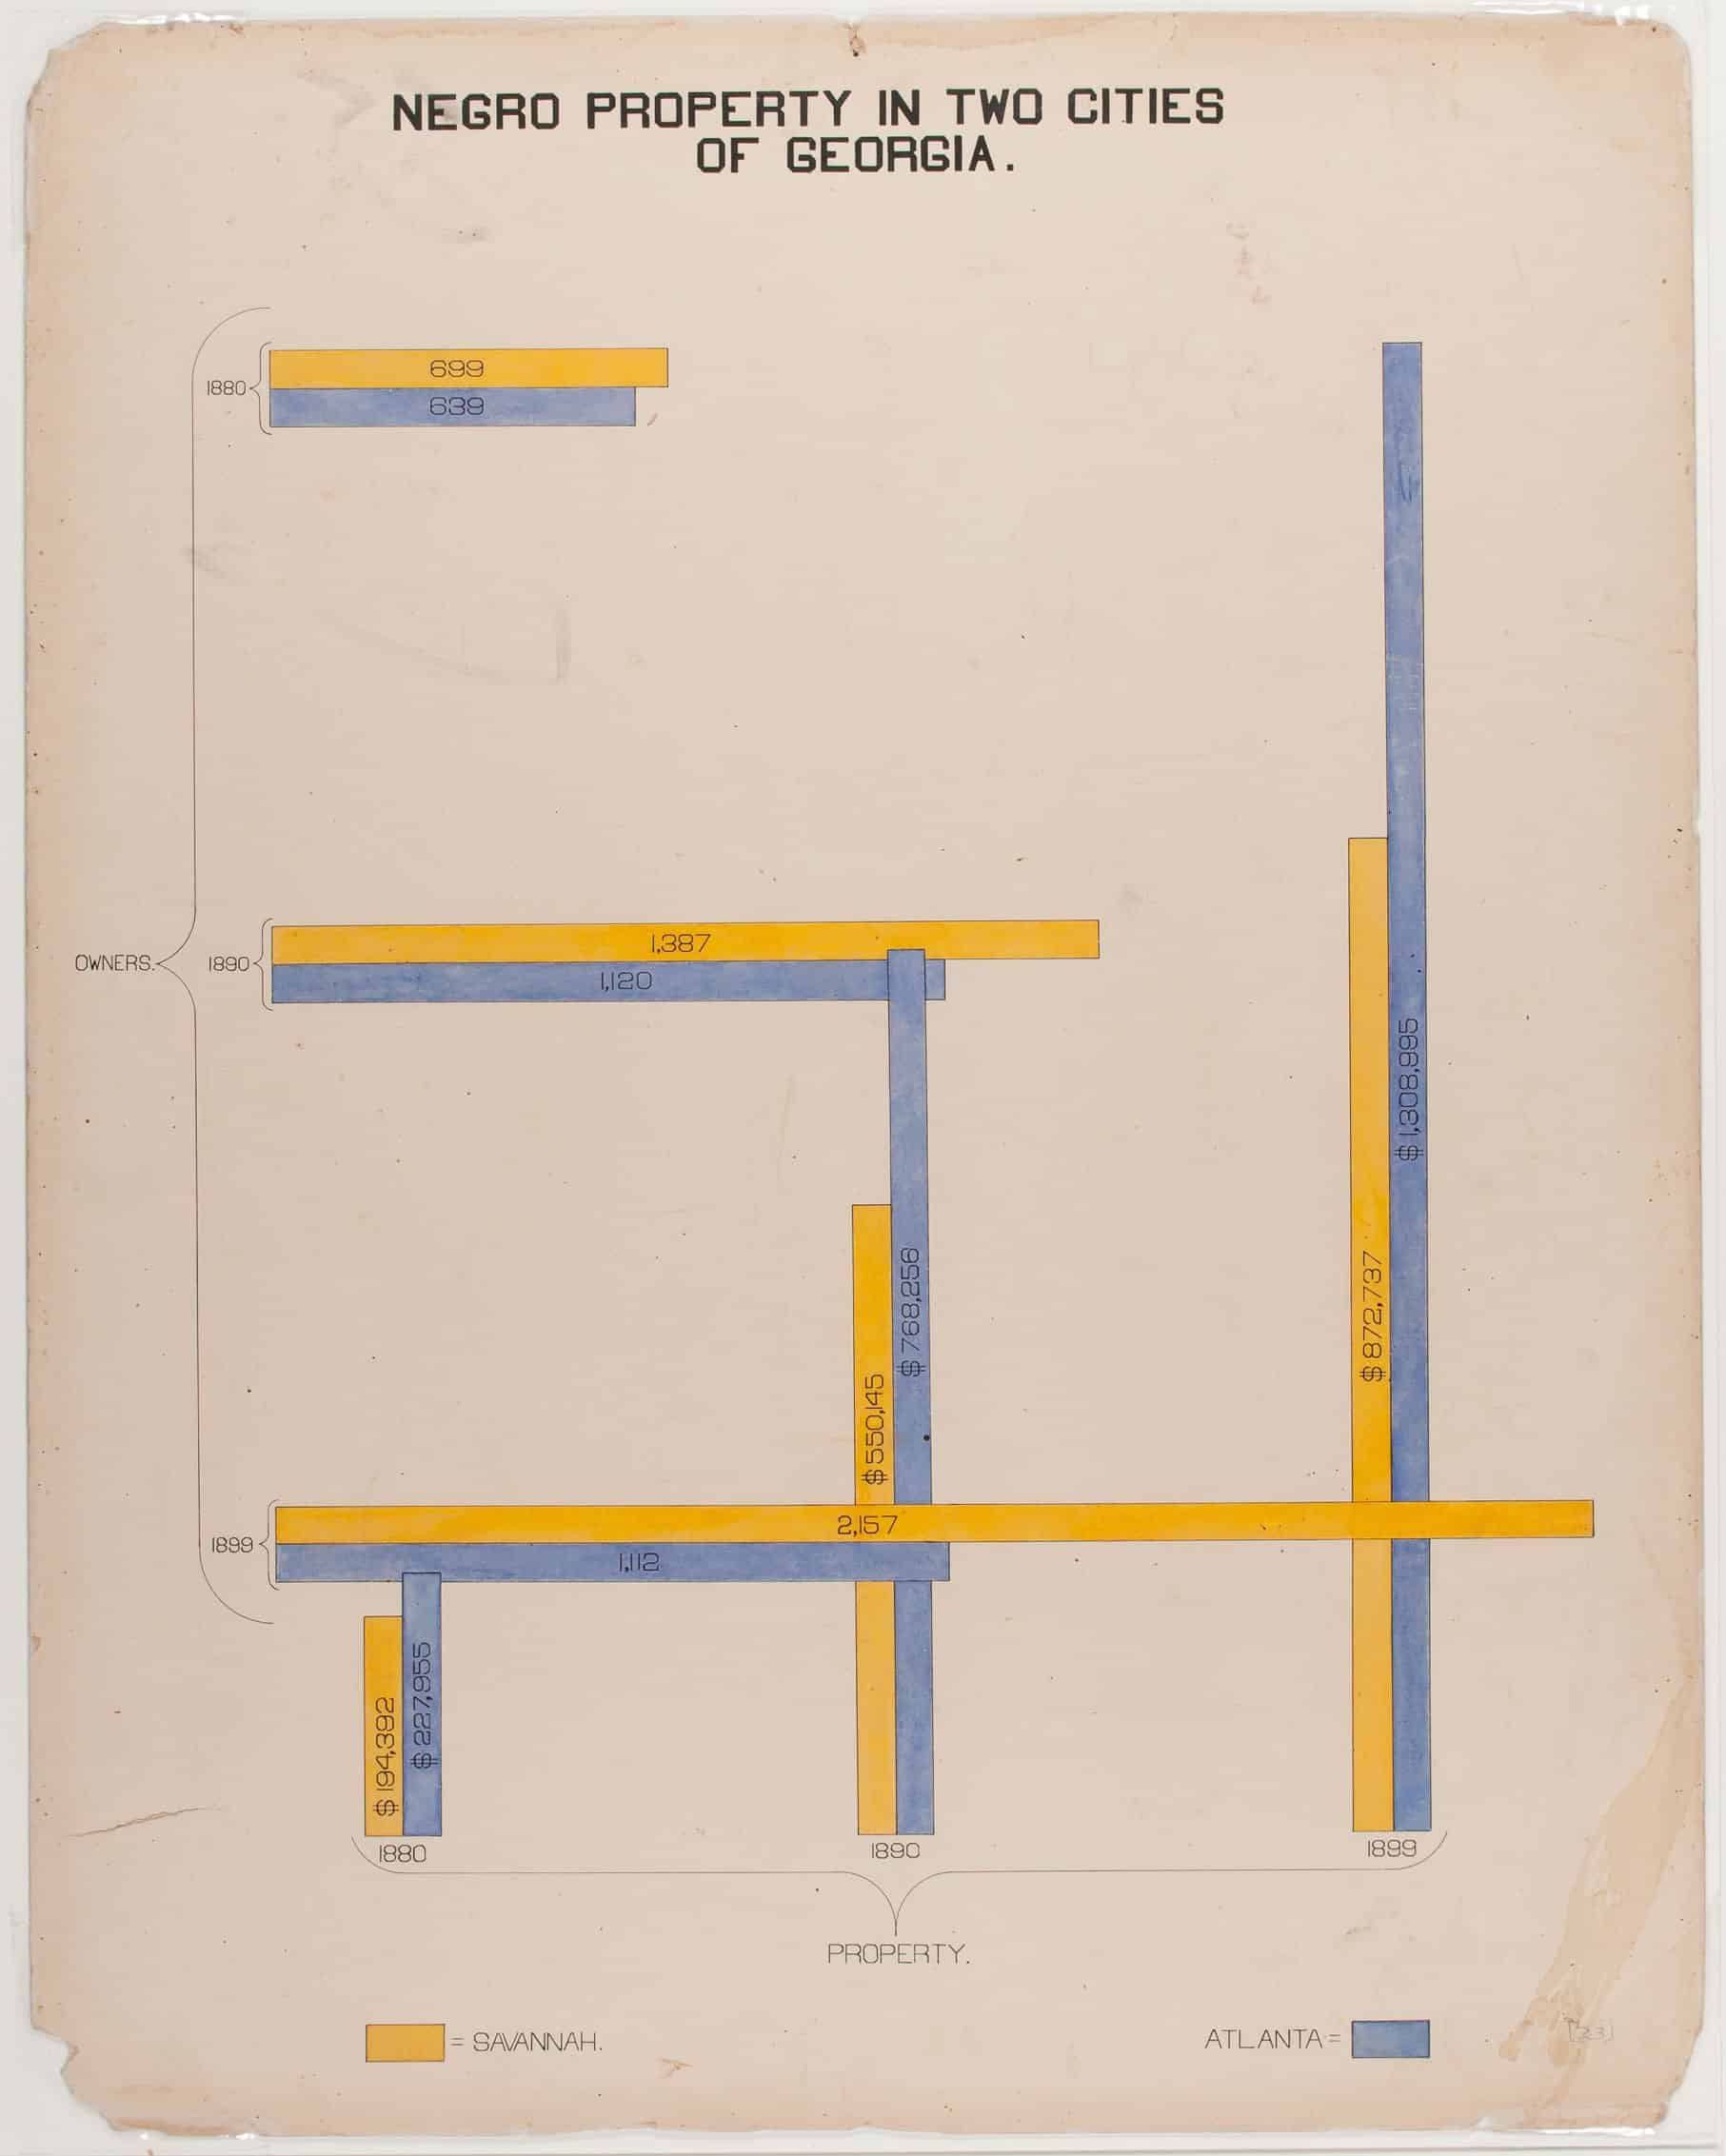
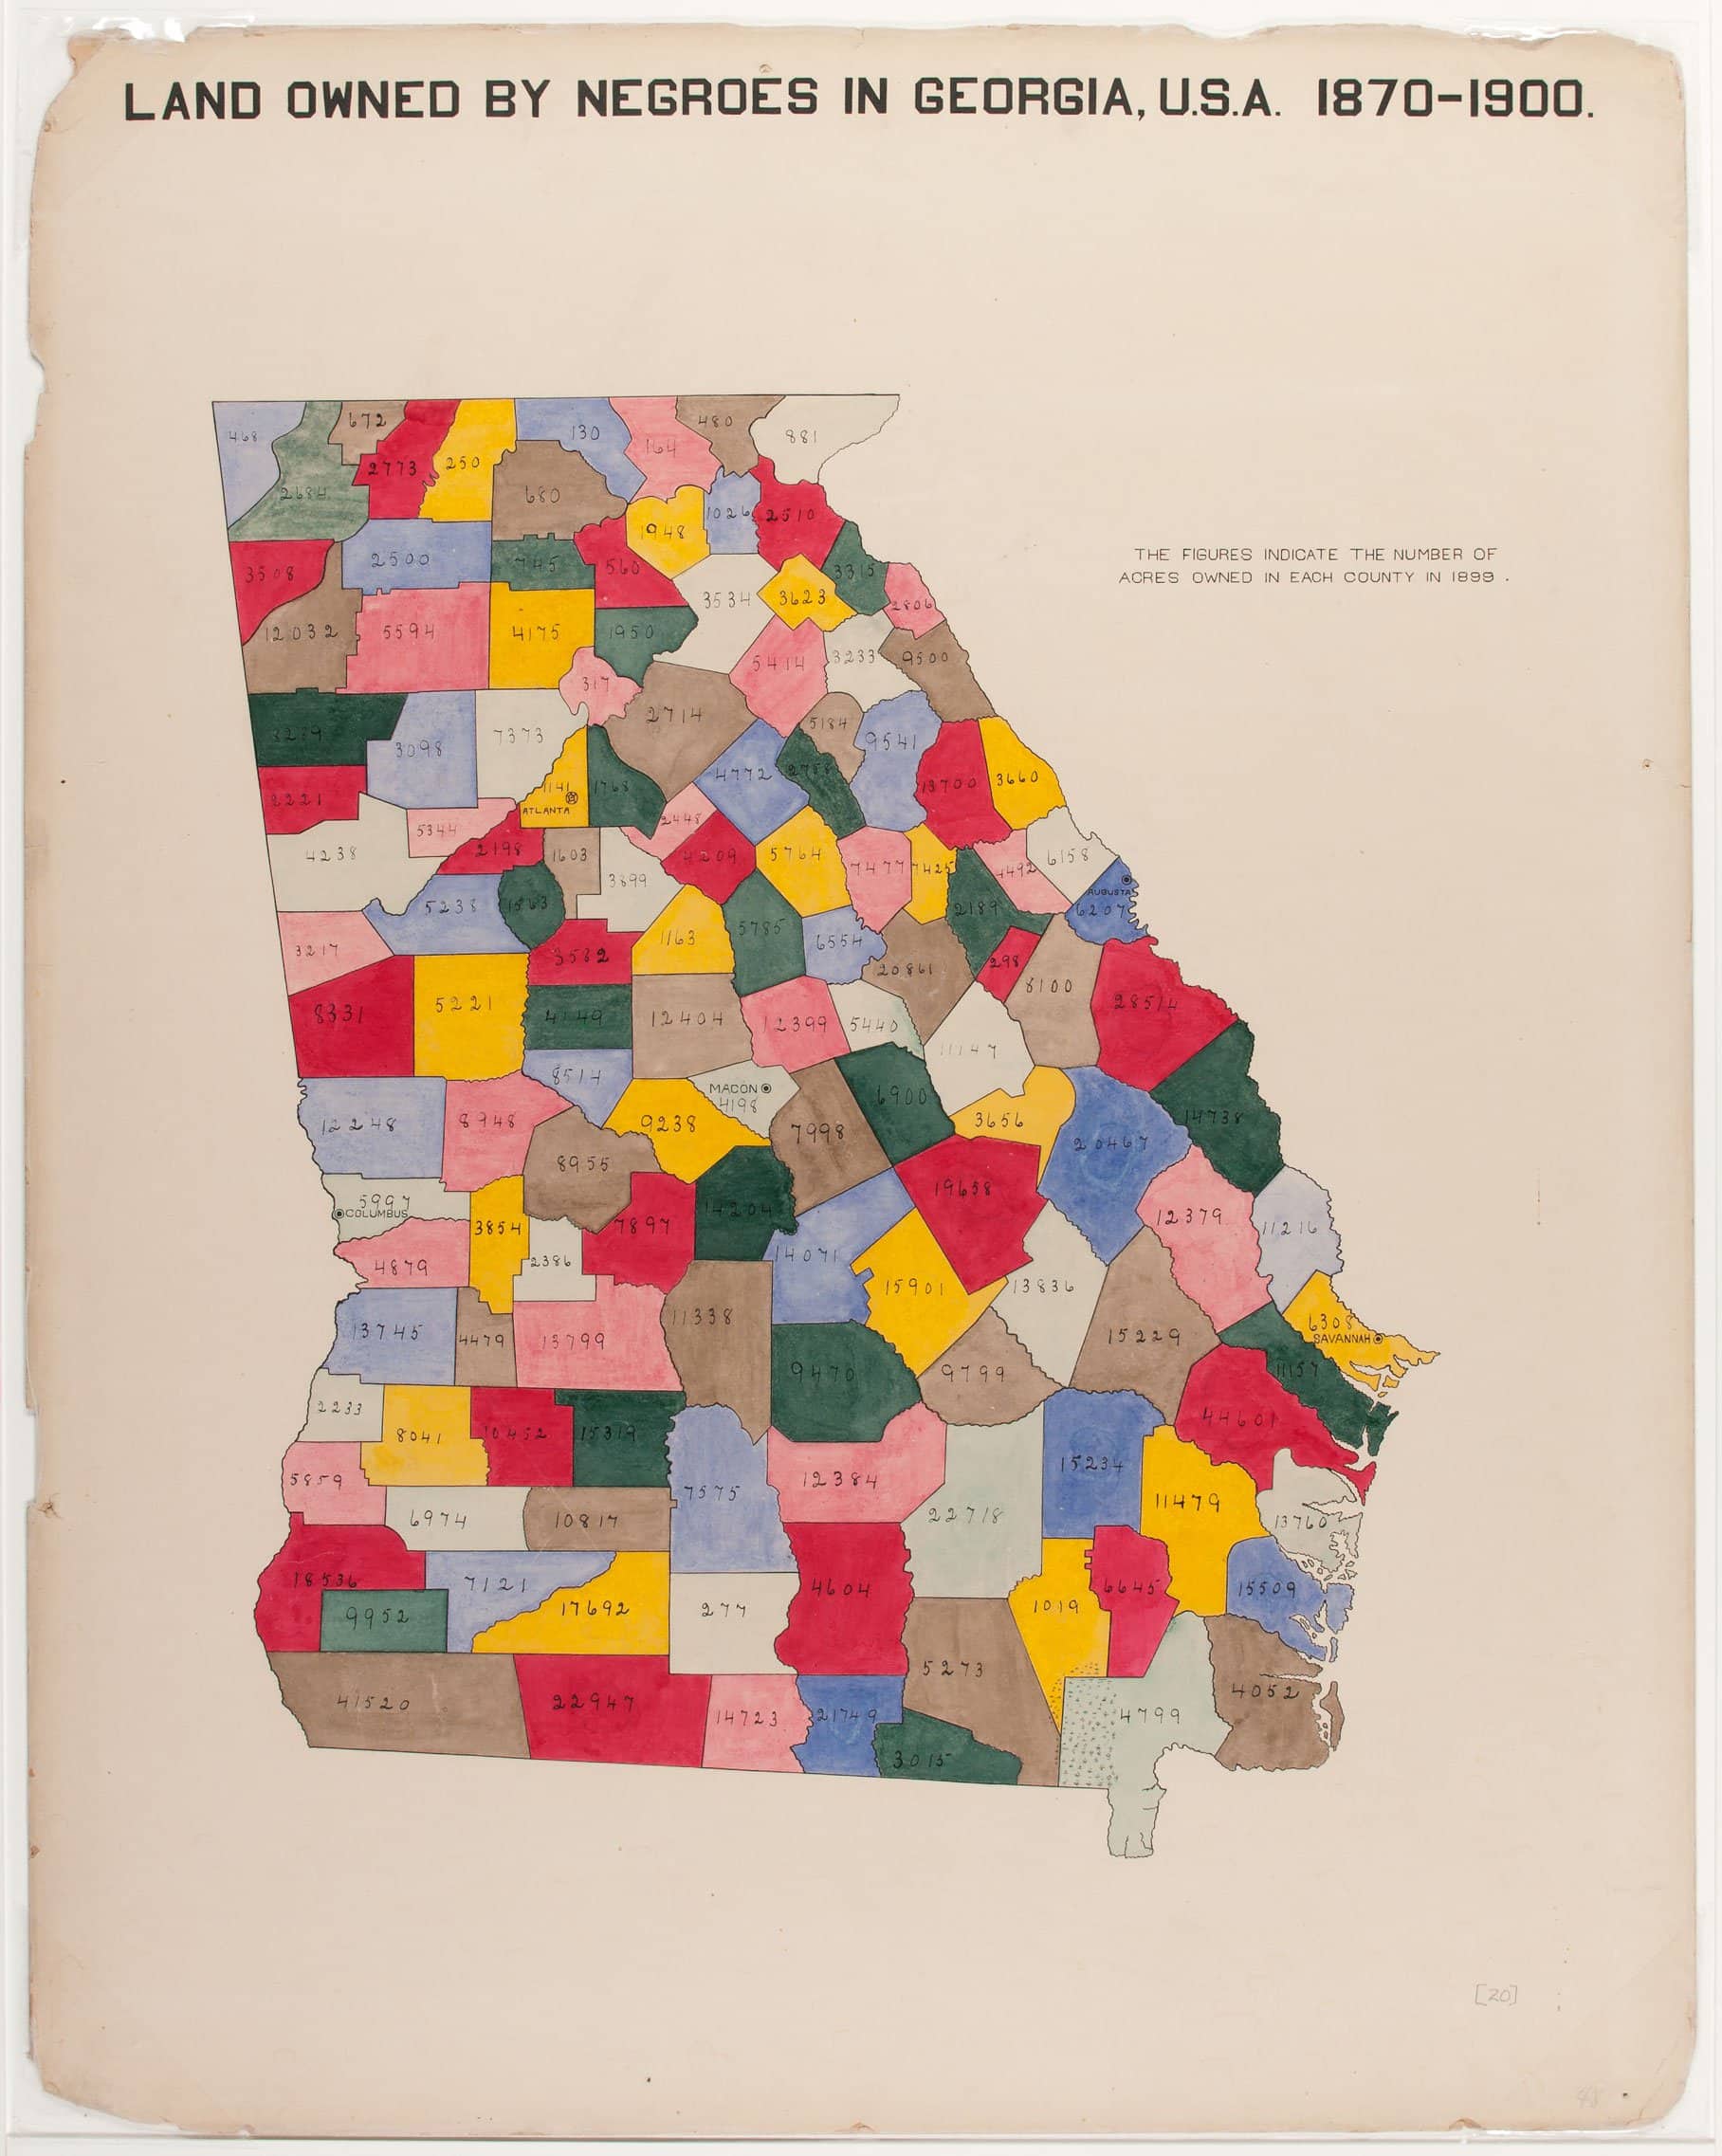
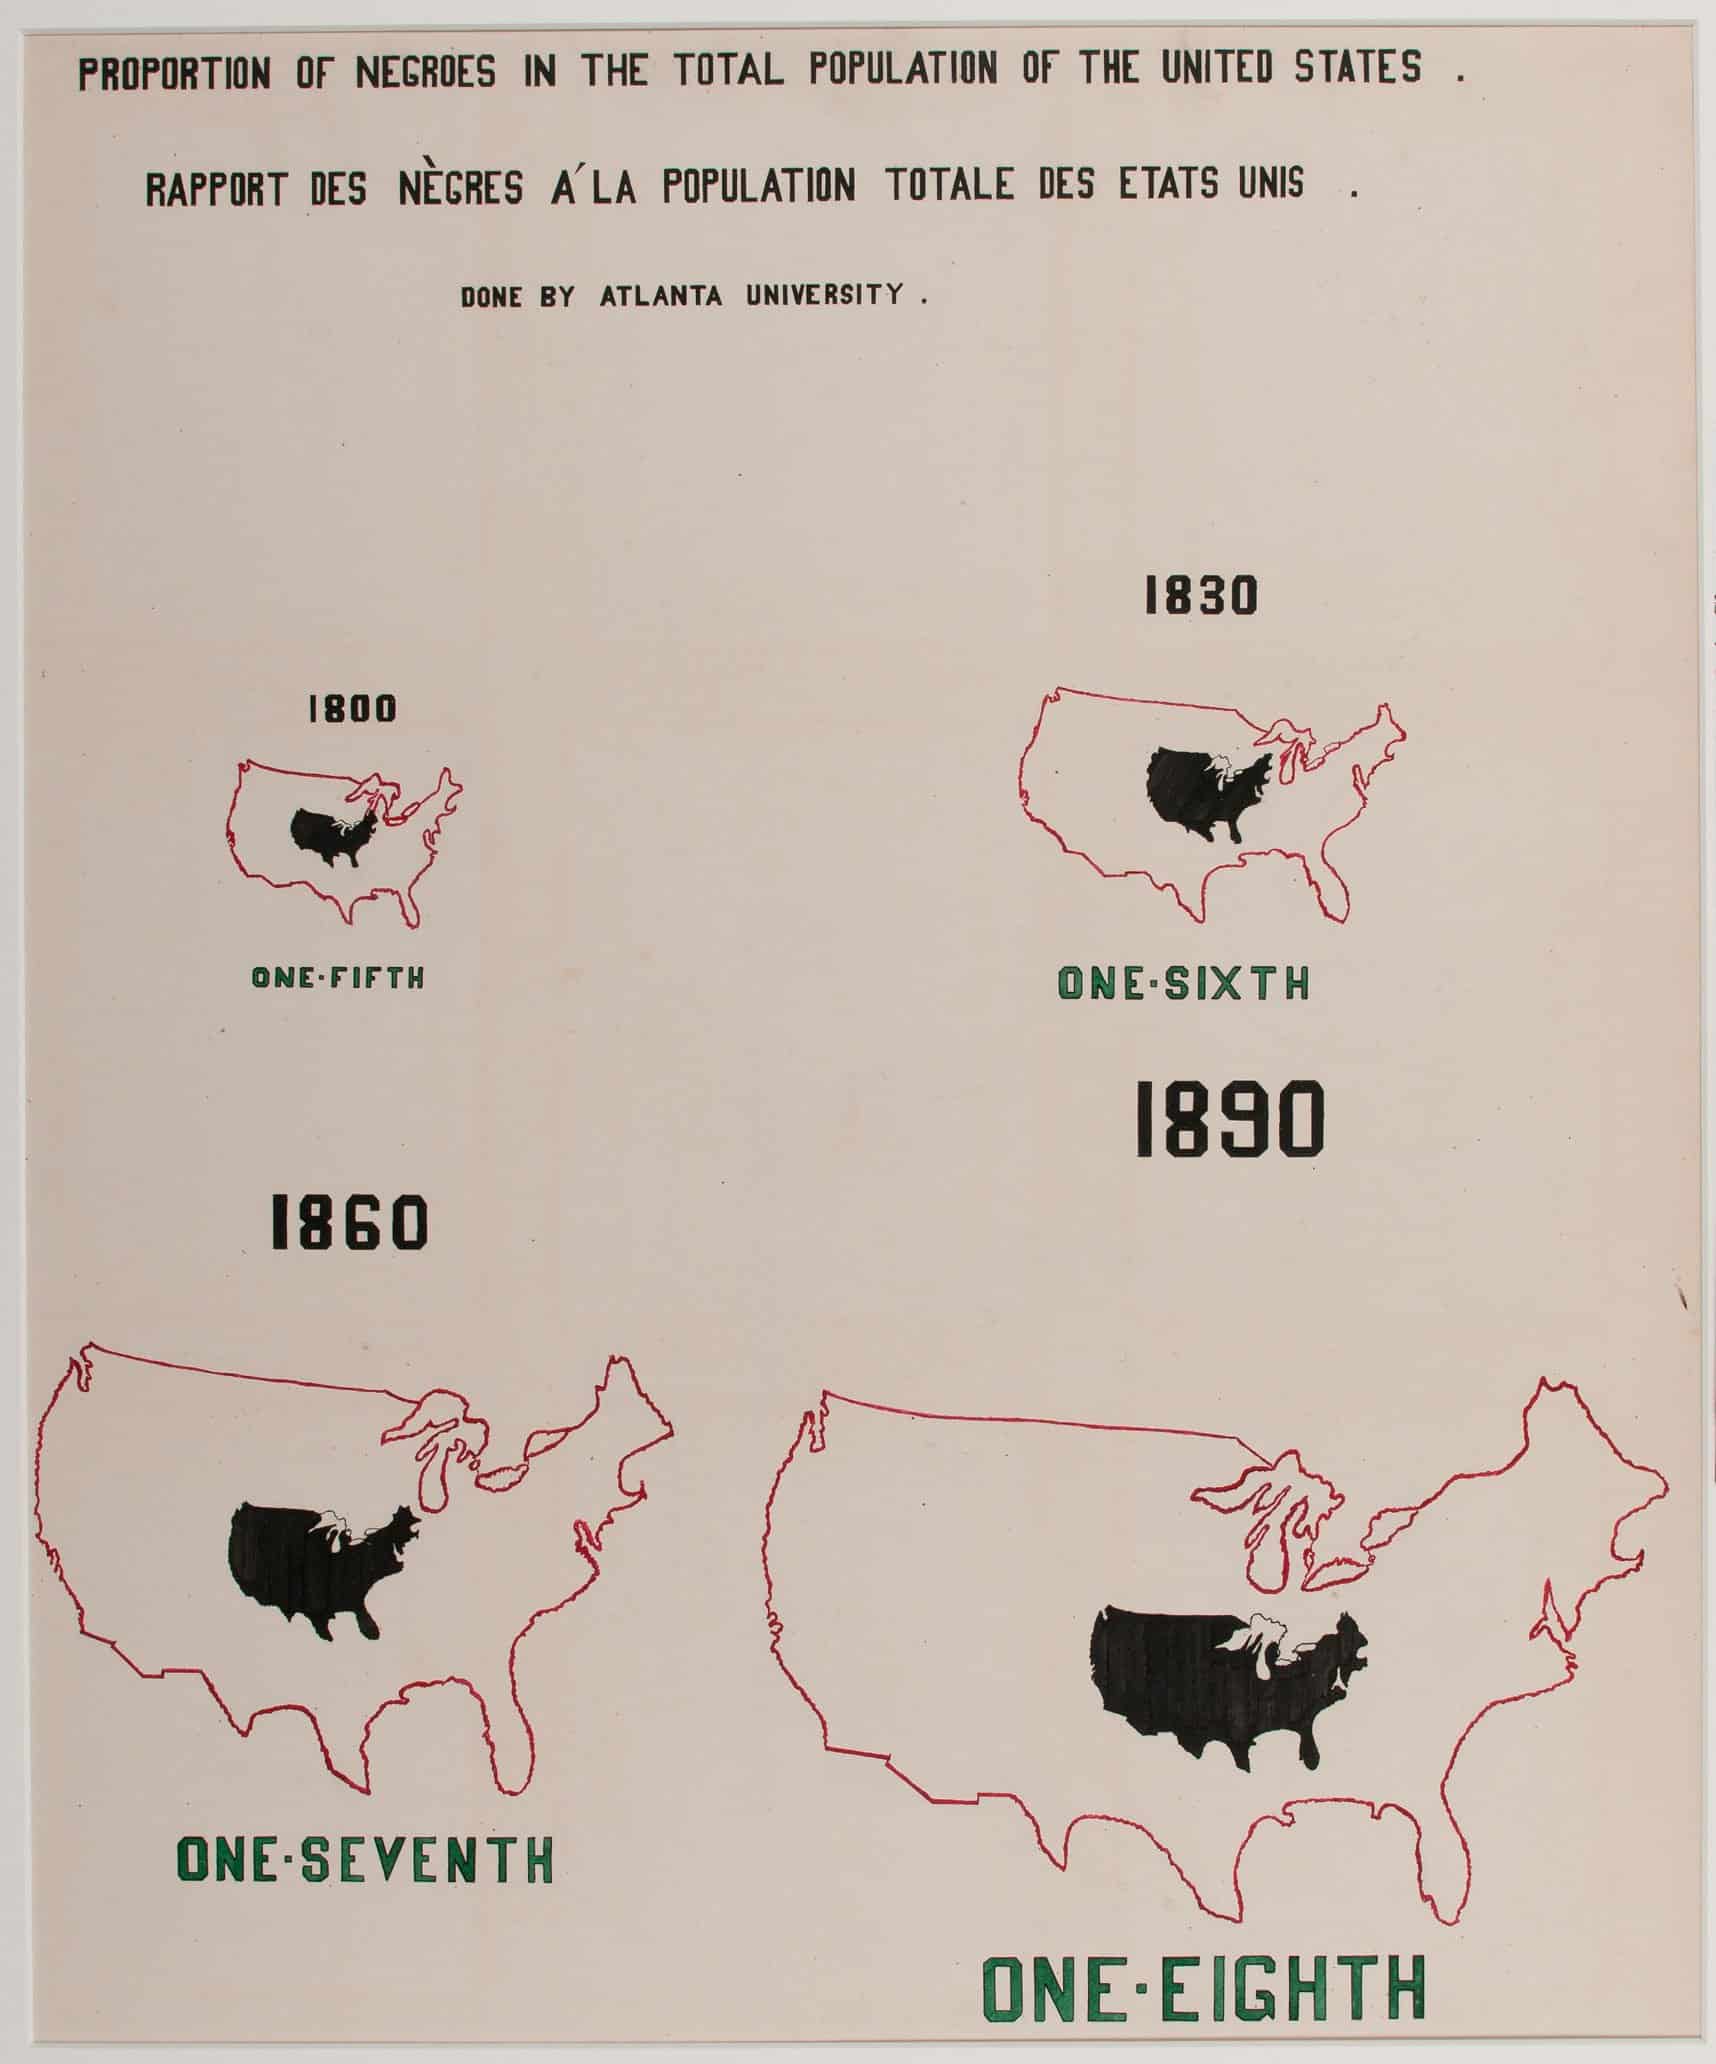
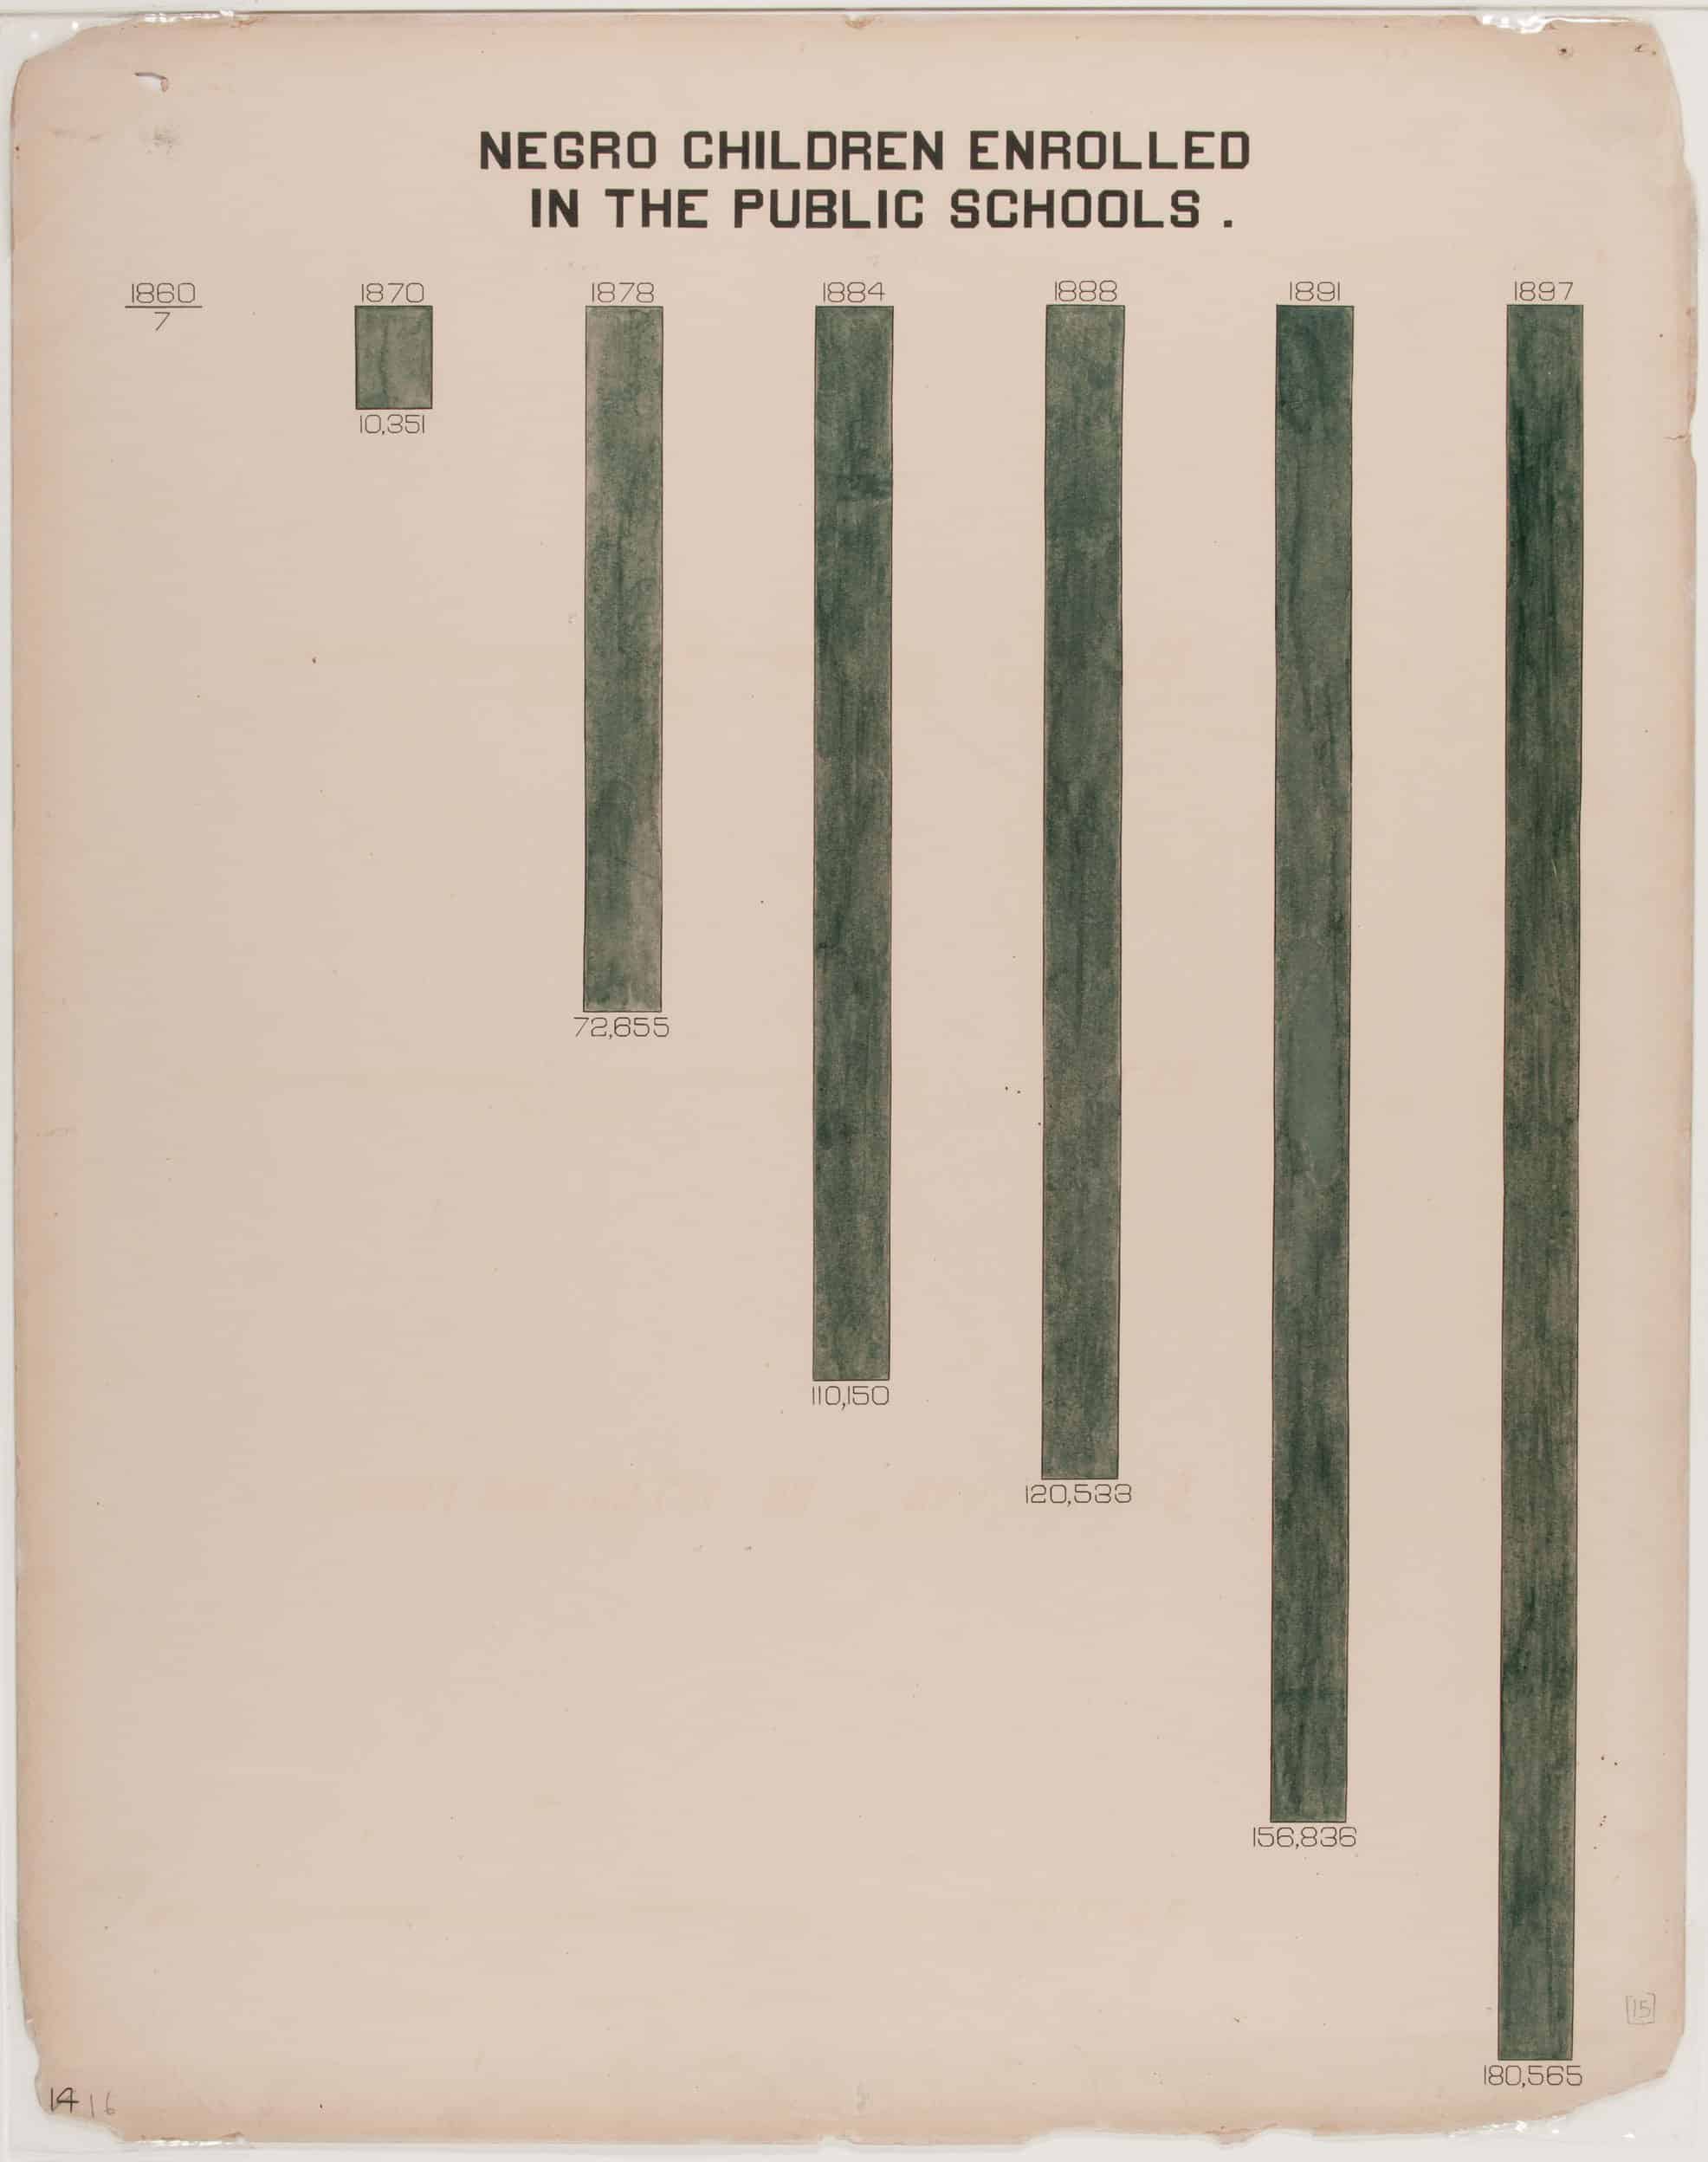
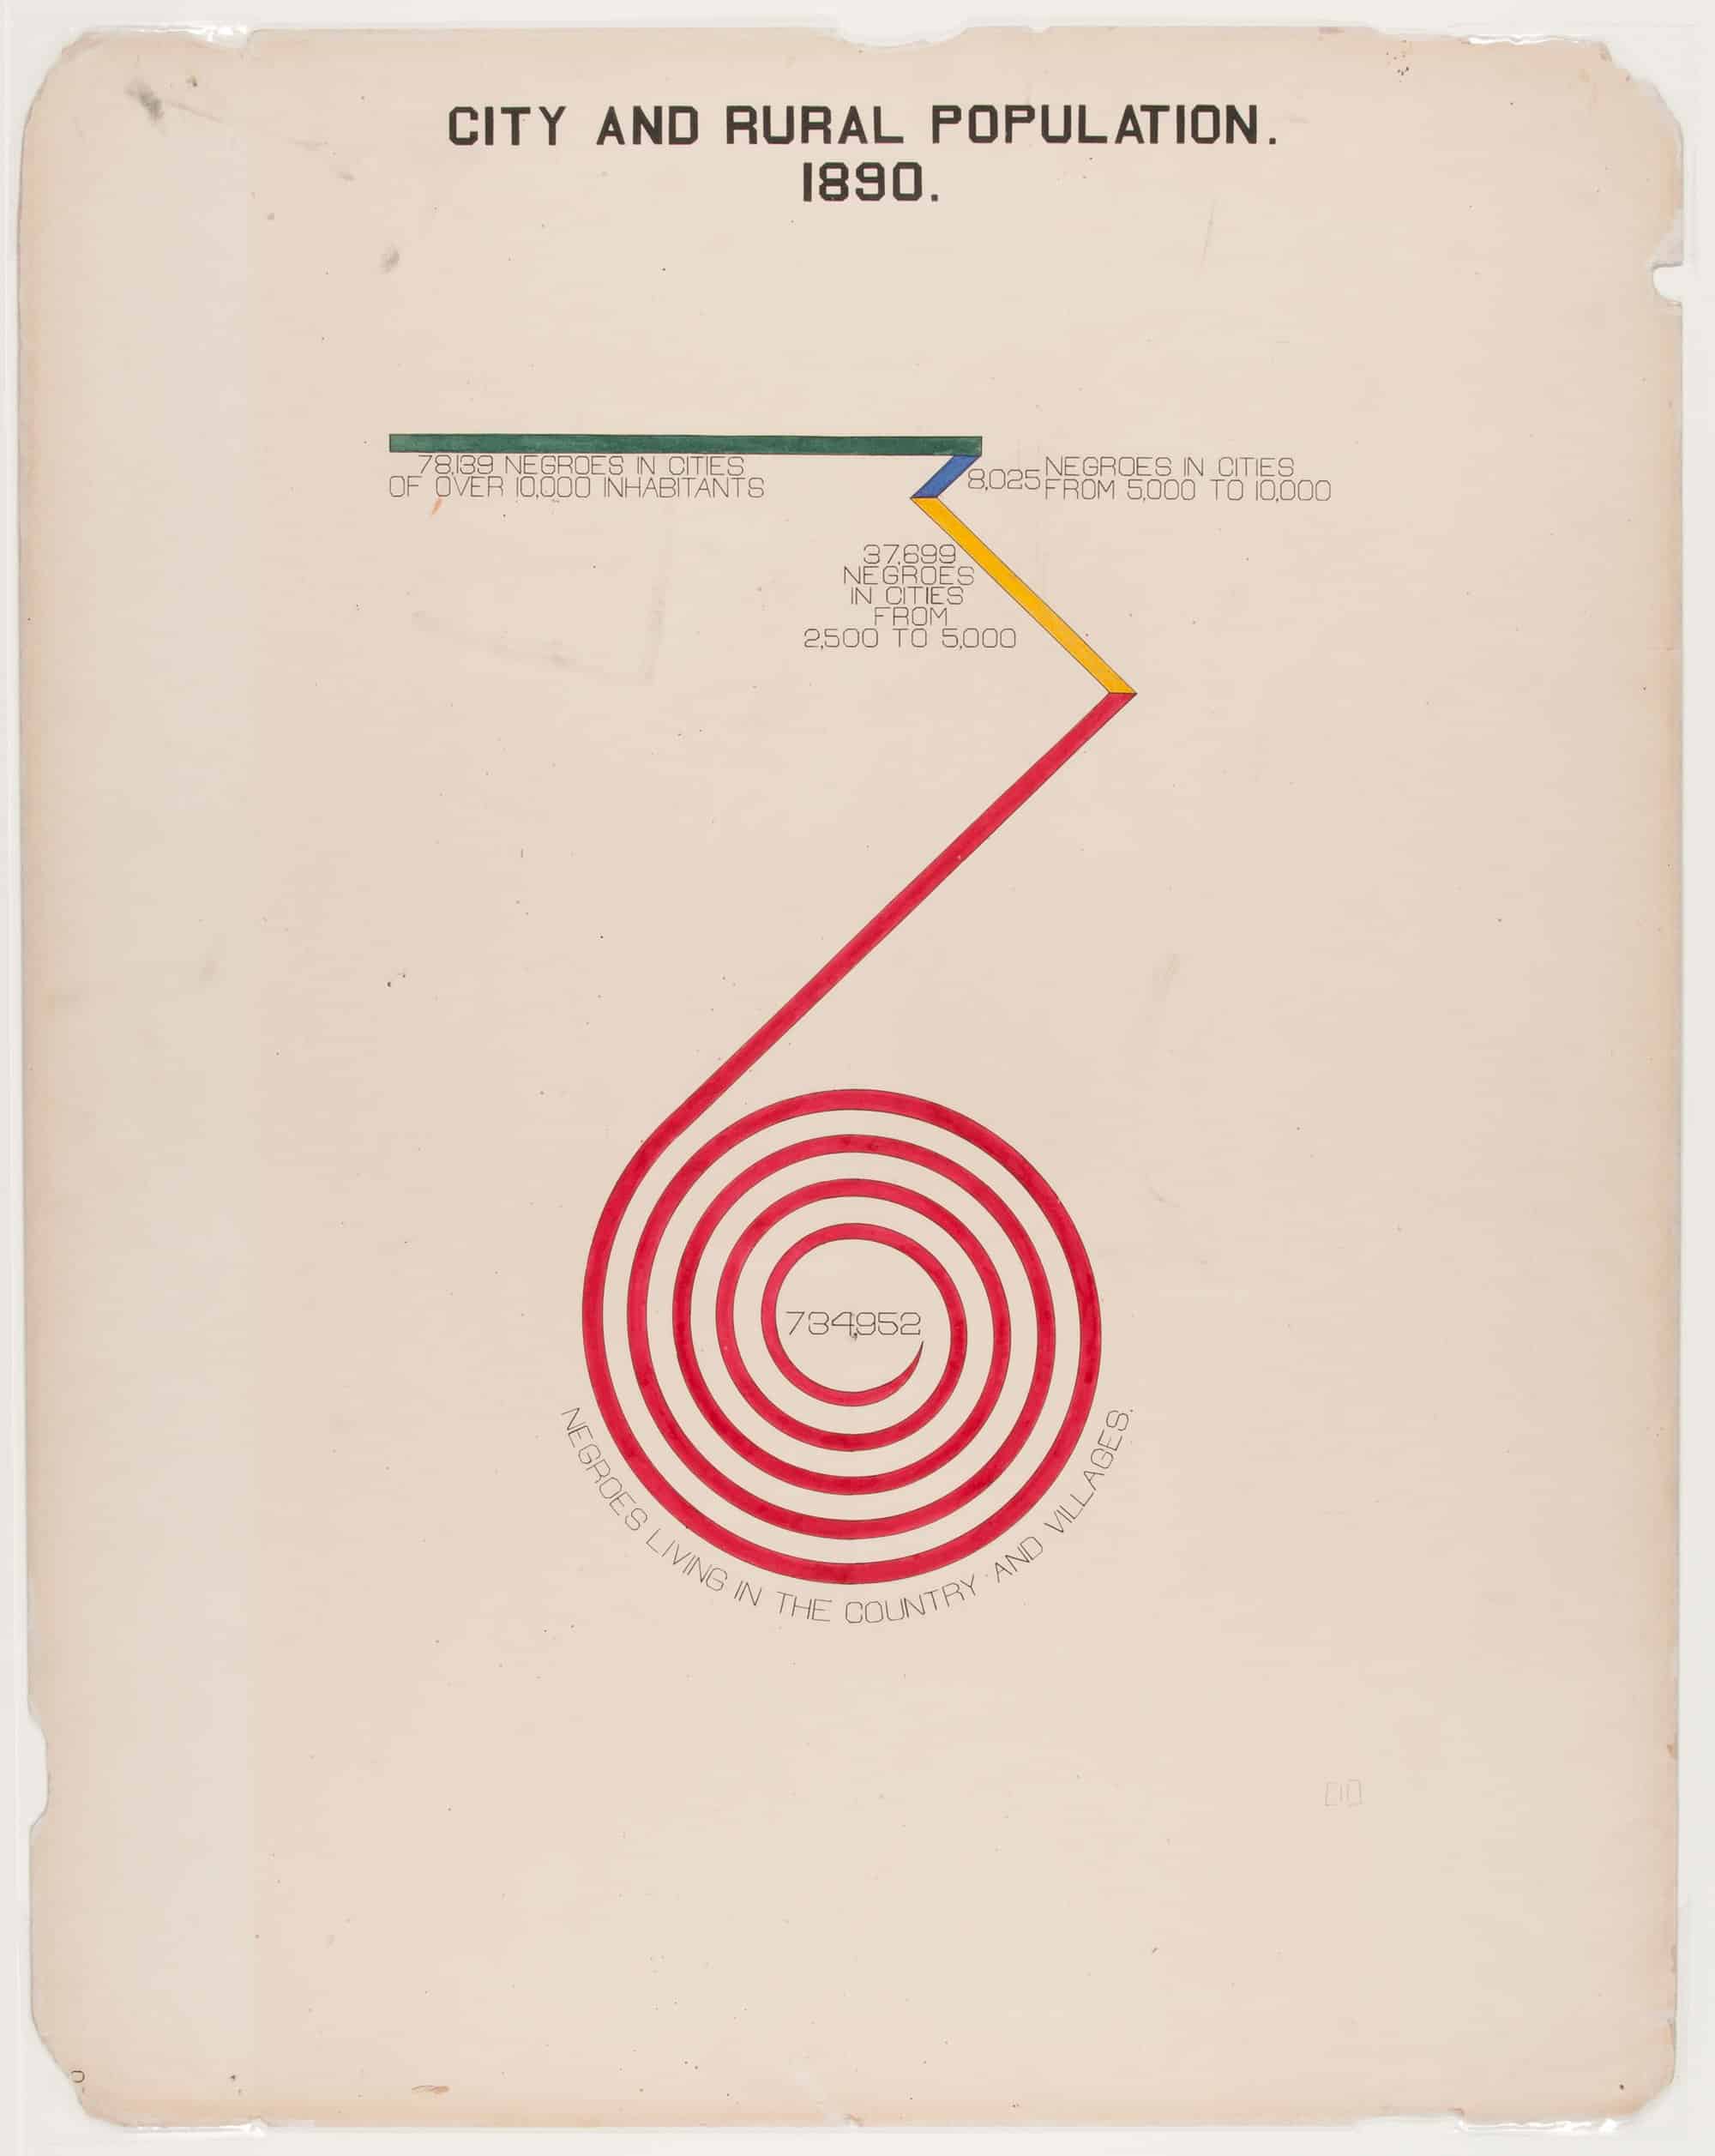
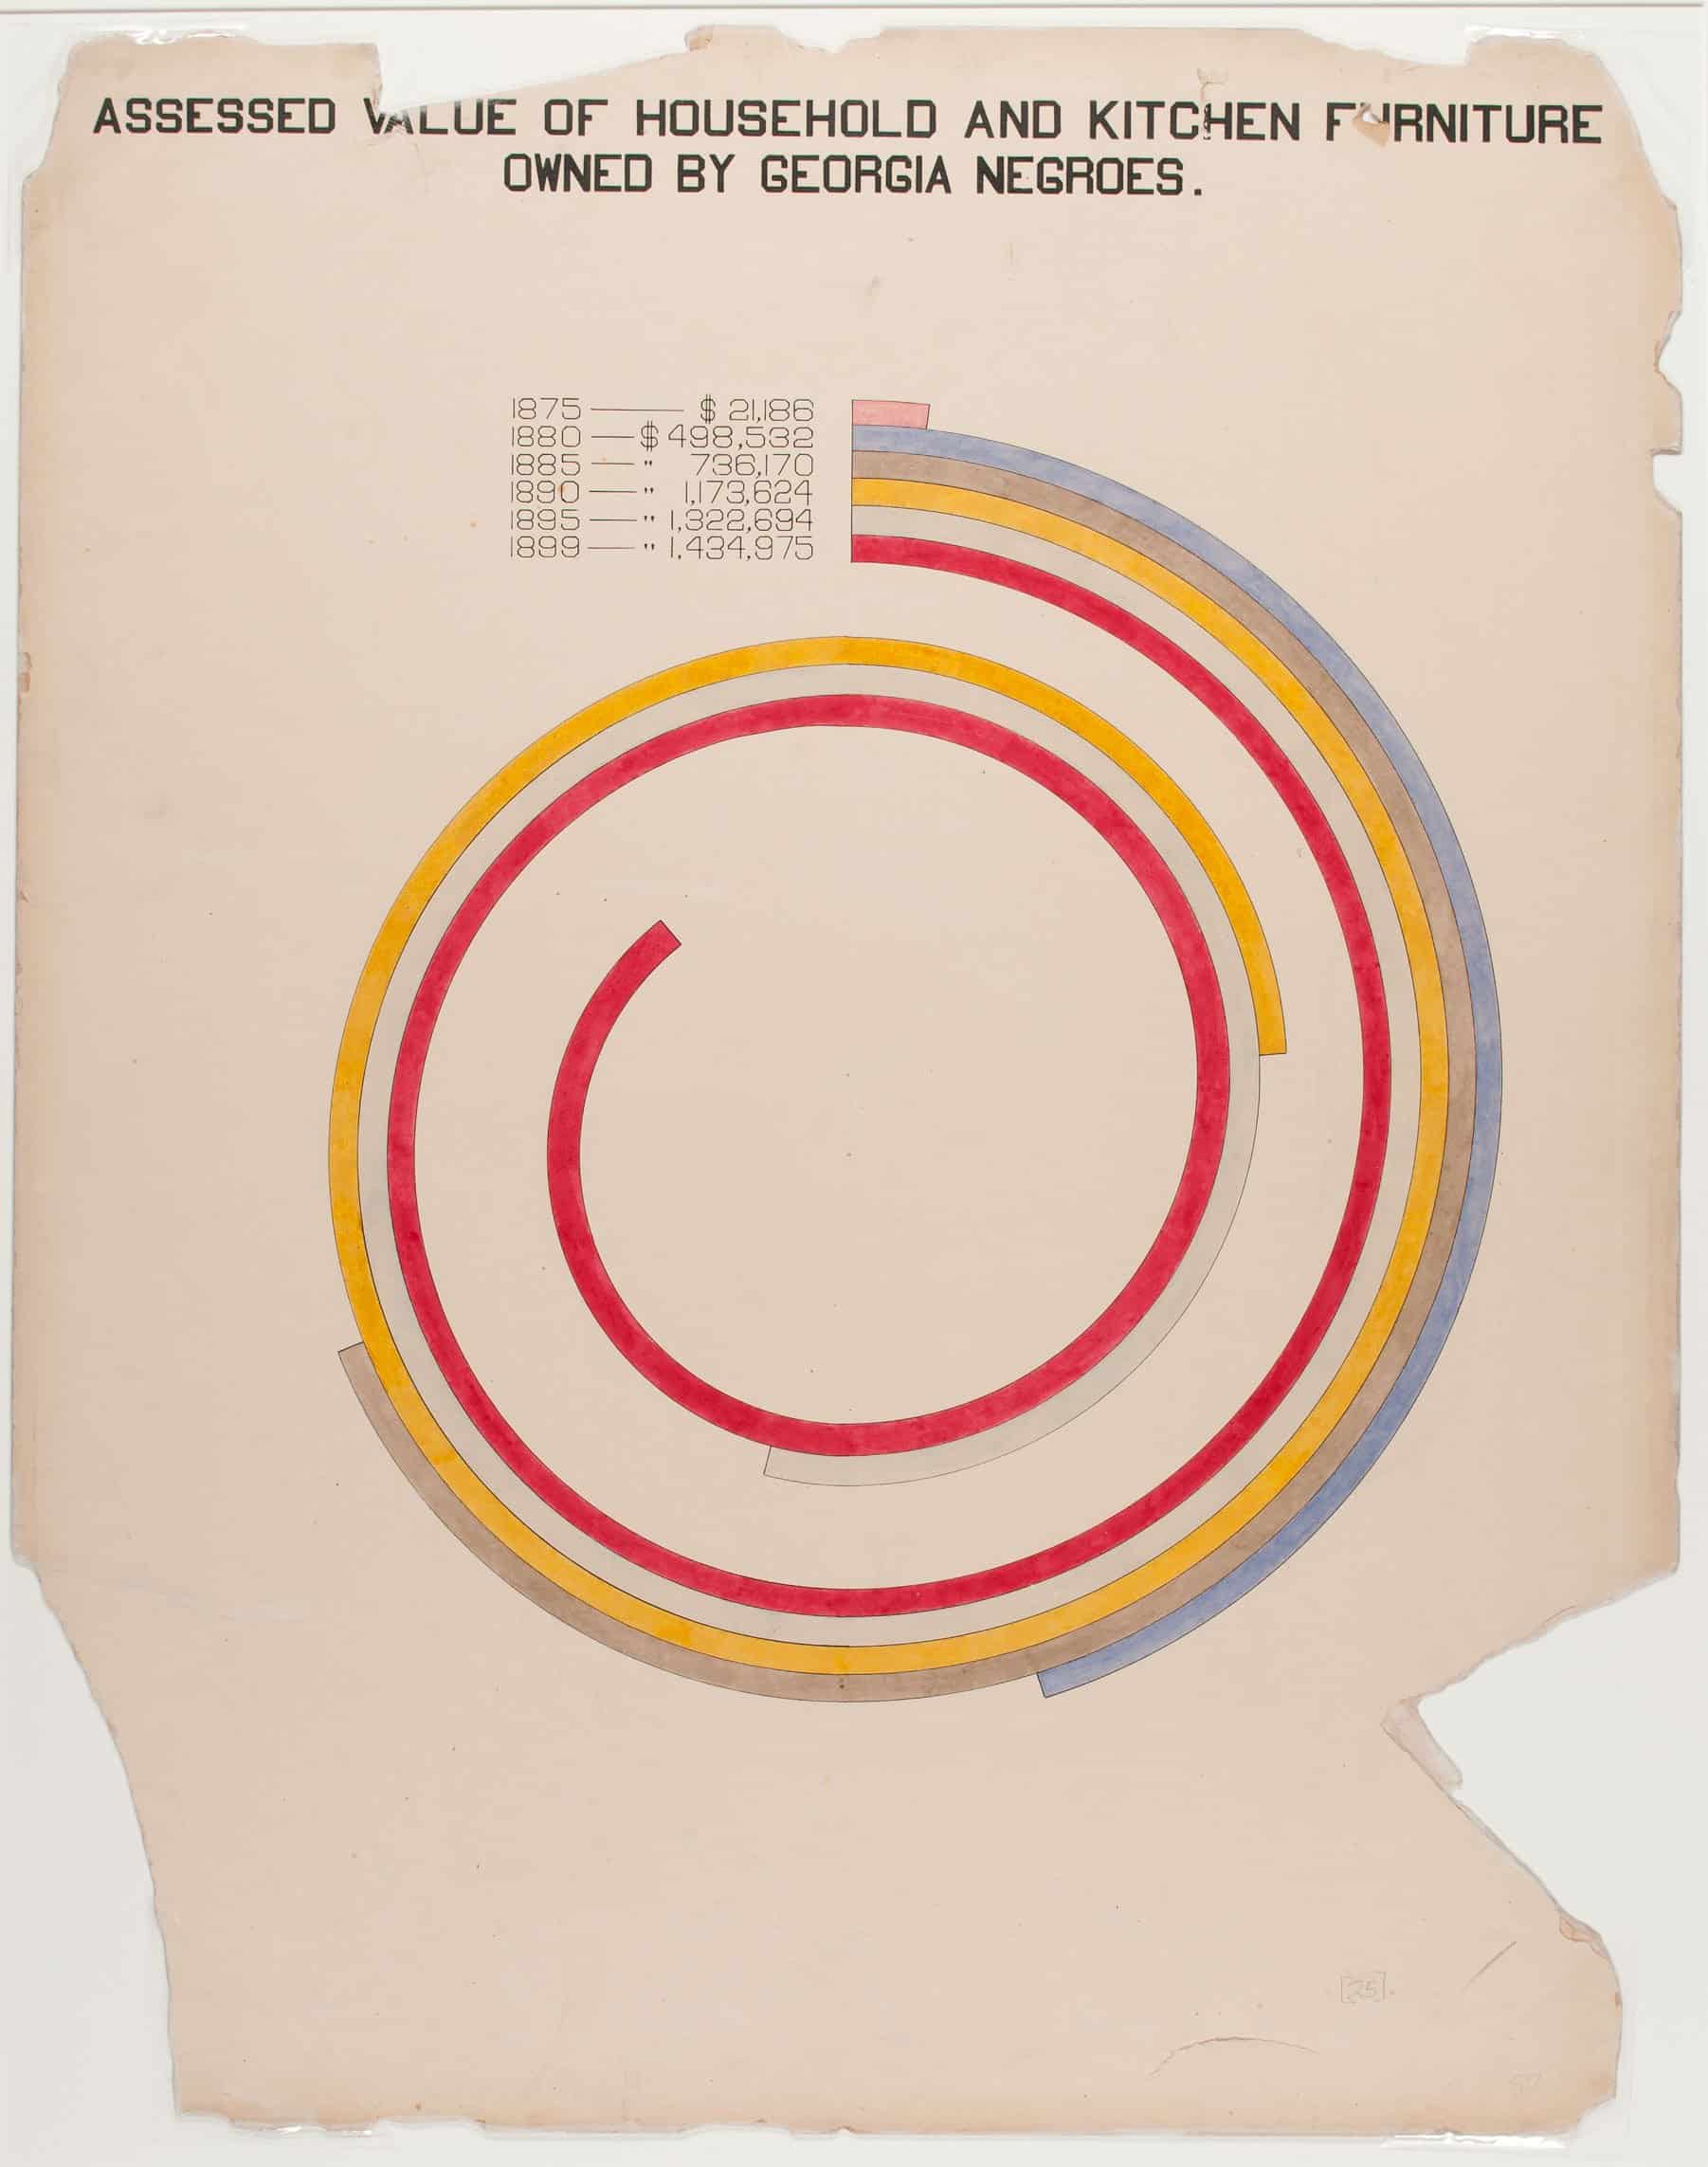
Alongside this were 58 hand-drawn charts produced by Du Bois with student assistants, which focused on the socioeconomic lives of African American since the abolishment of slavery. A number of these charts centre on data collected in Georgia, then the state with the highest black population. They are significant for their inventive, Mondrian-esque colour combinations and compositions, and their ability to anticipate the necessity and power of infographics to convey data. But they also gave voice to a part of the US population that had been left out of statistics. ‘We have thus, it may be seen, an honest, straightforward exhibit of a small nation of people’, summarised Du Bois, ‘picturing their life and development without apology or gloss, and above all made by themselves. In a way this marks an era in the history of the Negroes of America.’

While the exhibition saw thousands of visitors, and the organisers and participating institutions received two Grand Prix and more than a dozen other medals, the ‘American Negro’ was ignored by most of the American press.

An exposition report later stated: ‘It is impossible to do justice to this exhibit in a few lines of descriptive matter. The material presented was not only of high scientific value, but was shown in the most graphic way. There was no better example at the Exposition of the appreciation of the Exposition idea that exhibits must be made attractive and interesting.’

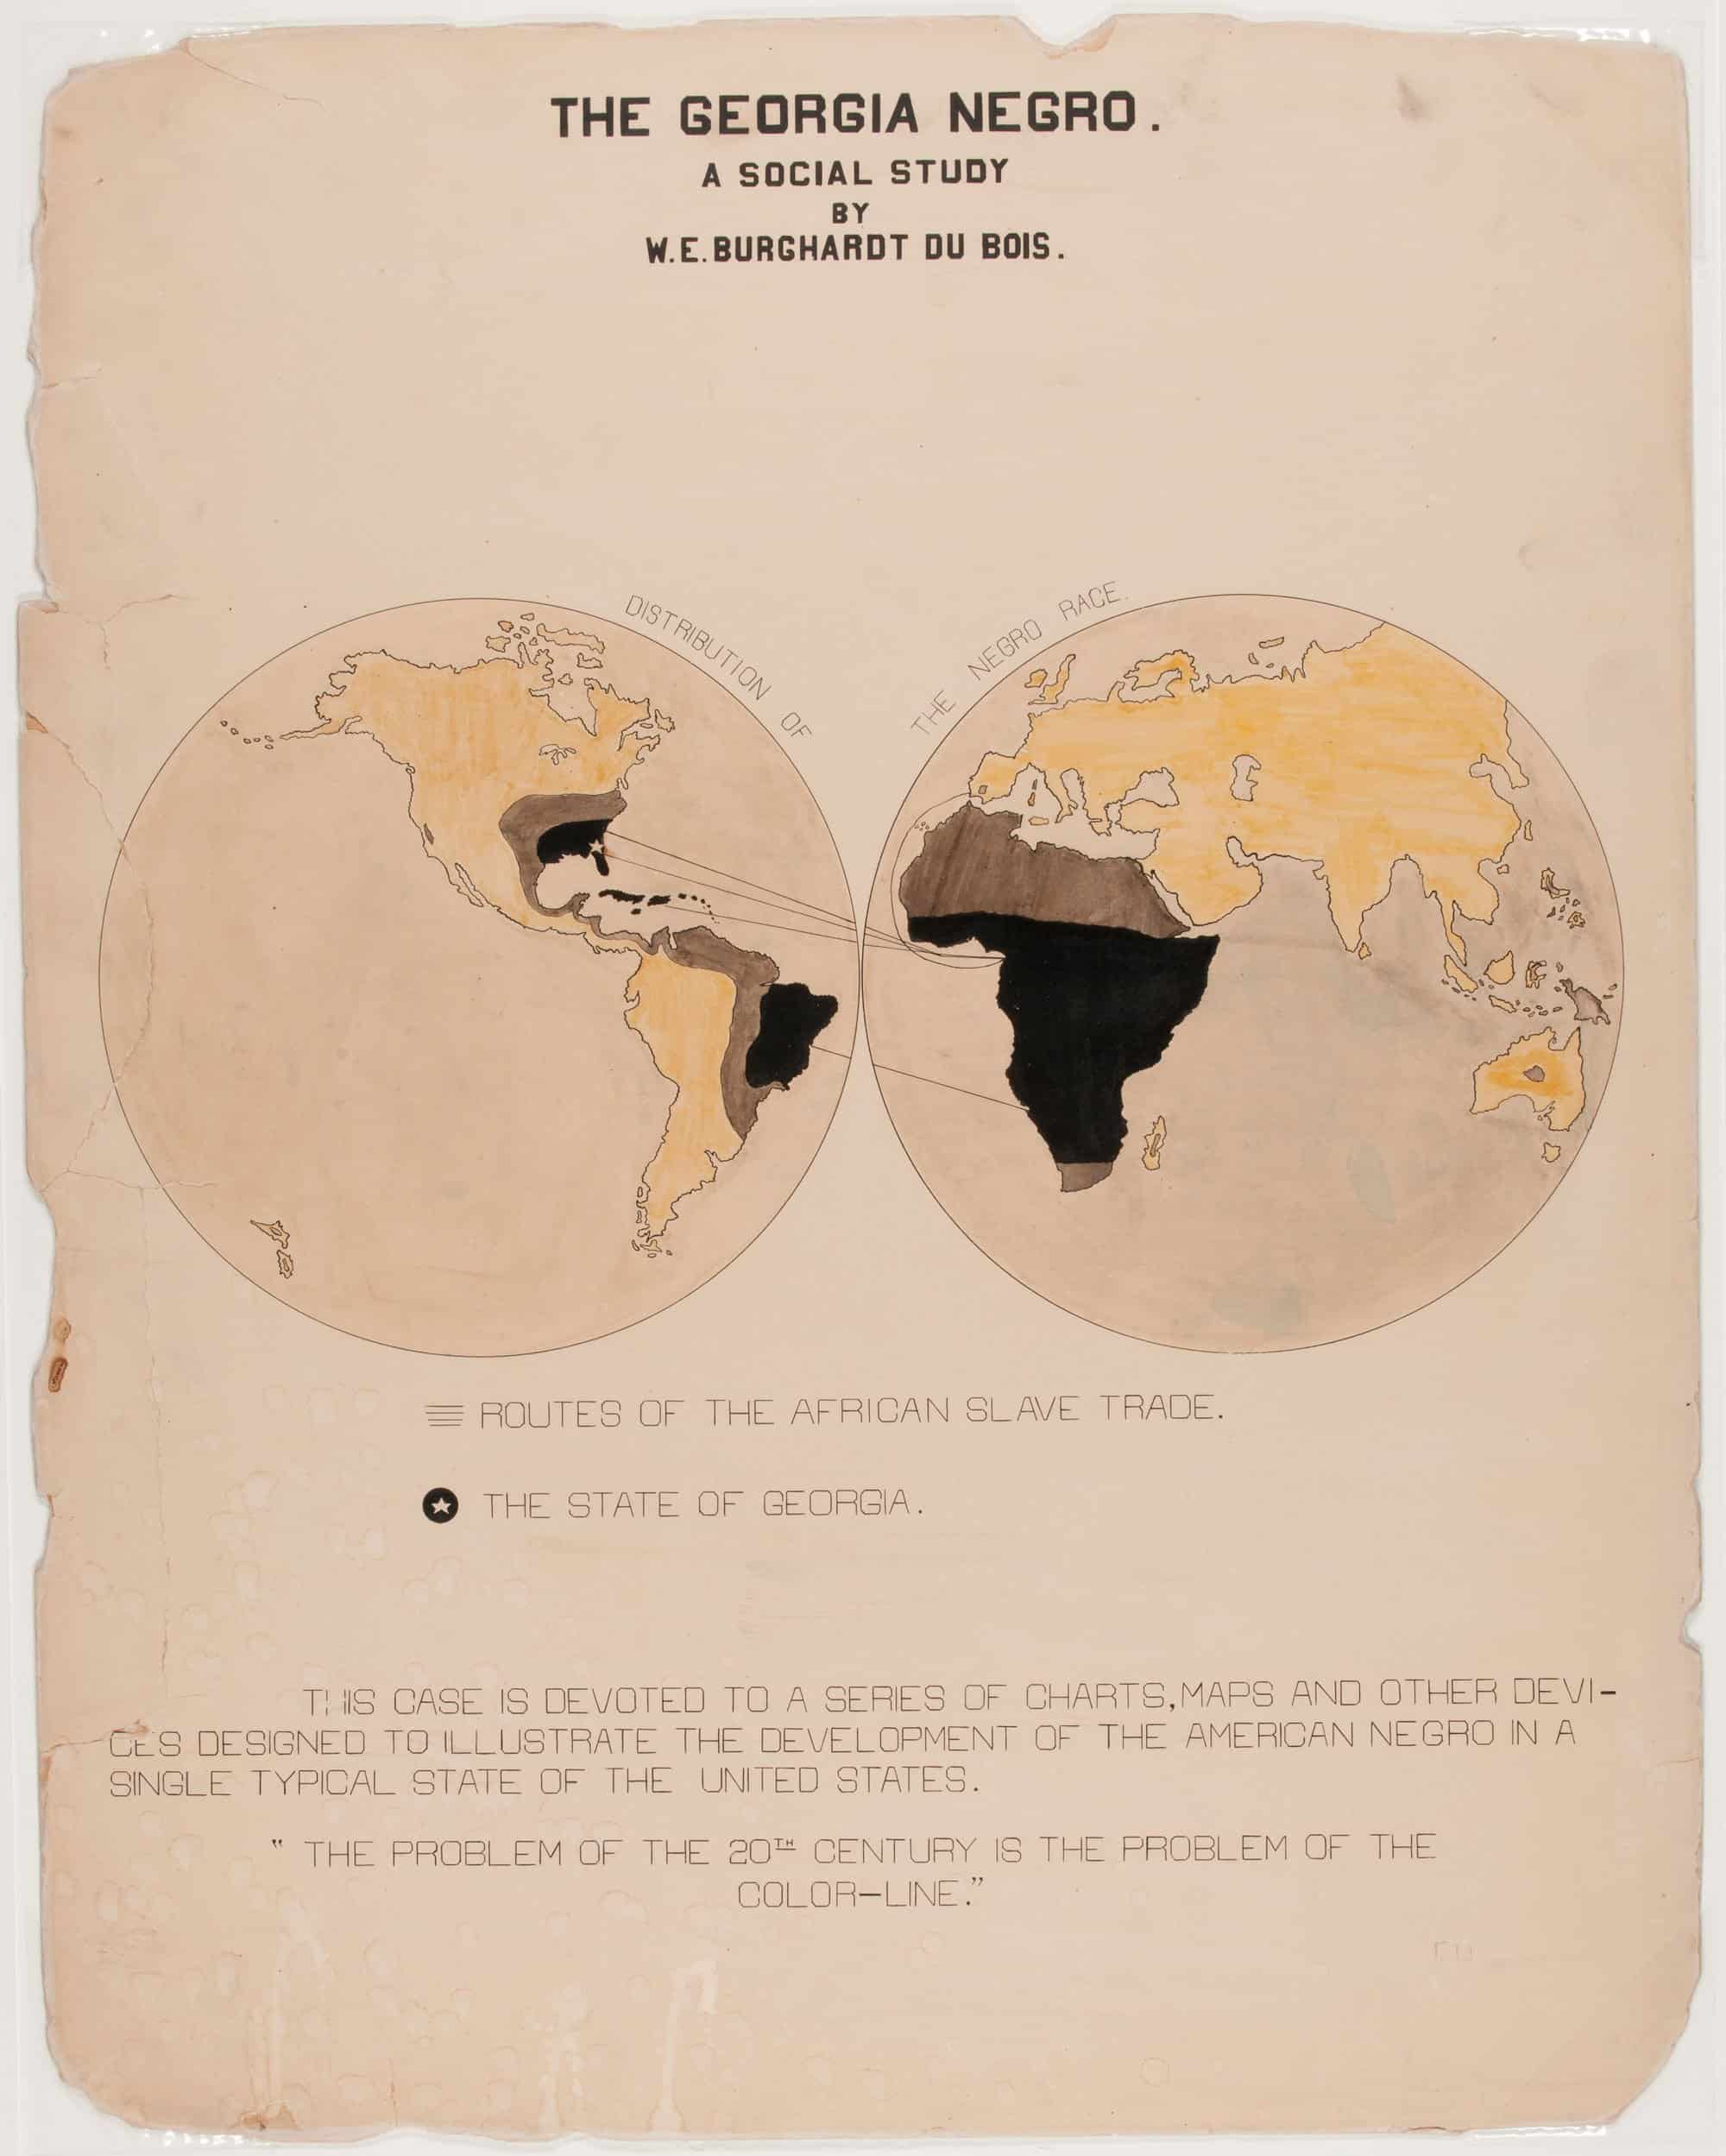
At the bottom of a graphic titled the ‘Georgia Negro’, which charts the routes of the African Slave trade to the southern state, Du Bois wrote: ‘The problem of the 20th century is the problem of the color-line.’ A sentence made famous when it appeared in the Souls of Black Folk, which Du Bois published three years later.

One of 58 charts and graphs compiled for the ‘American Negro’ display at the Exposition universelle
William Edward Burghardt Du Bois (1868–1963), Paris, 1900–1900. Ink and watercolour, 710 × 560 mm. Library of Congress.
One of 58 charts and graphs compiled for the ‘American Negro’ display at the Exposition universelle
William Edward Burghardt Du Bois (1868–1963), Paris, 1900–1900. Ink and watercolour, 710 × 560 mm. Library of Congress.
One of 58 charts and graphs compiled for the ‘American Negro’ display at the Exposition universelle
William Edward Burghardt Du Bois (1868–1963), Paris, 1900–1900. Ink and watercolour, 710 × 560 mm. Library of Congress.
One of 58 charts and graphs compiled for the ‘American Negro’ display at the Exposition universelle
William Edward Burghardt Du Bois (1868–1963), Paris, 1900–1900. Ink and watercolour, 710 × 560 mm. Library of Congress.
One of 58 charts and graphs compiled for the ‘American Negro’ display at the Exposition universelle
William Edward Burghardt Du Bois (1868–1963), Paris, 1900–1900. Ink and watercolour, 710 × 560 mm. Library of Congress.
One of 58 charts and graphs compiled for the ‘American Negro’ display at the Exposition universelle
William Edward Burghardt Du Bois (1868–1963), Paris, 1900–1900. Ink and watercolour, 710 × 560 mm. Library of Congress.
One of 58 charts and graphs compiled for the ‘American Negro’ display at the Exposition universelle
William Edward Burghardt Du Bois (1868–1963), Paris, 1900–1900. Ink and watercolour, 710 × 560 mm. Library of Congress.