Drawing on the Nolli Plan
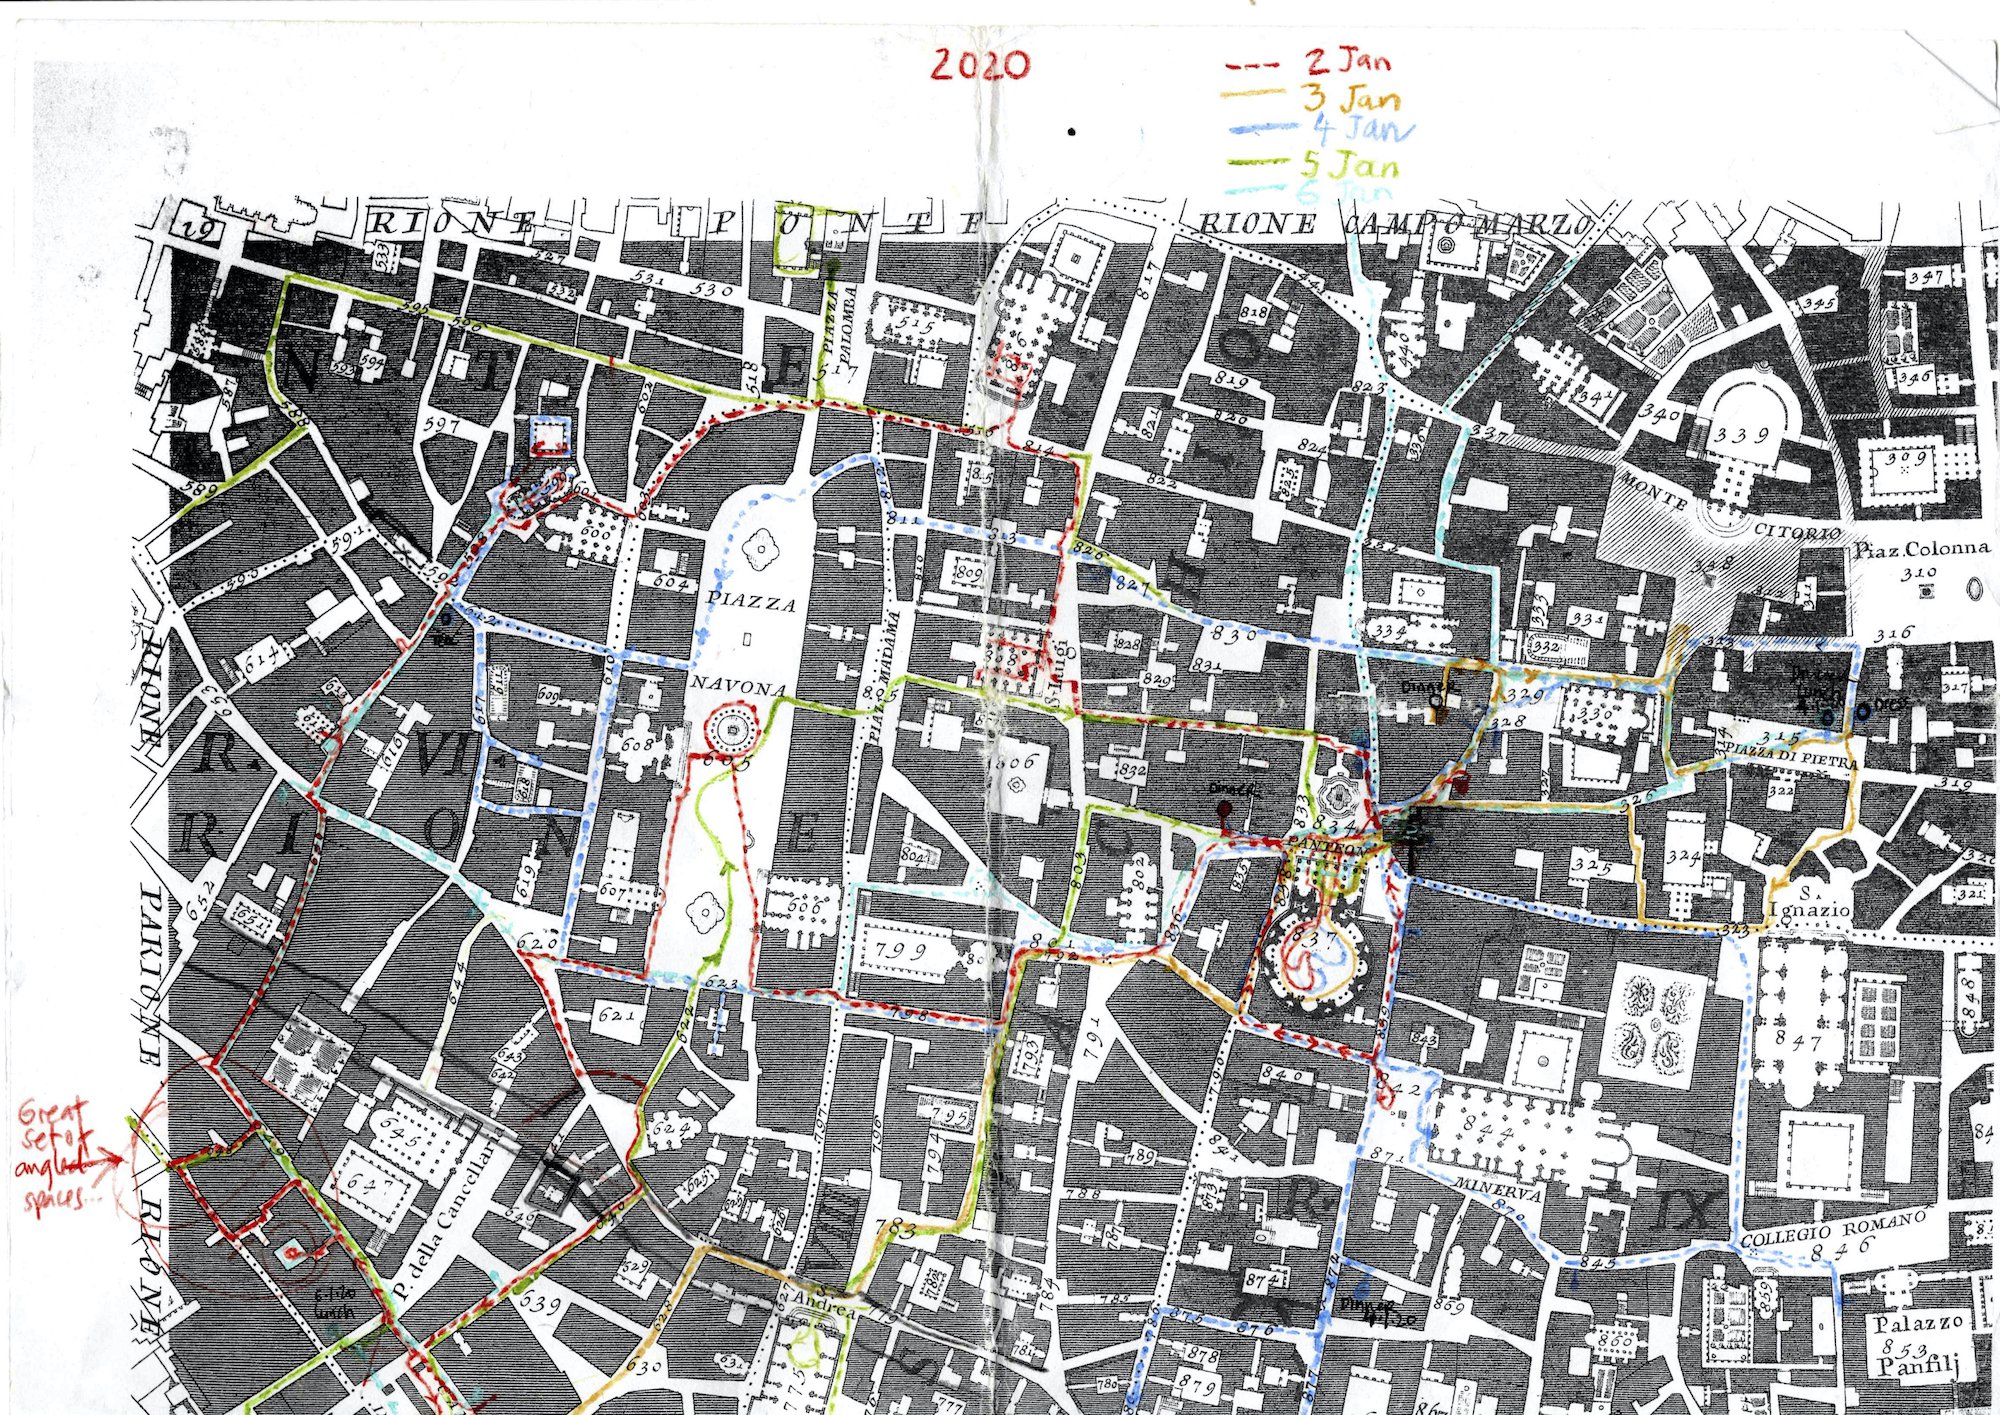
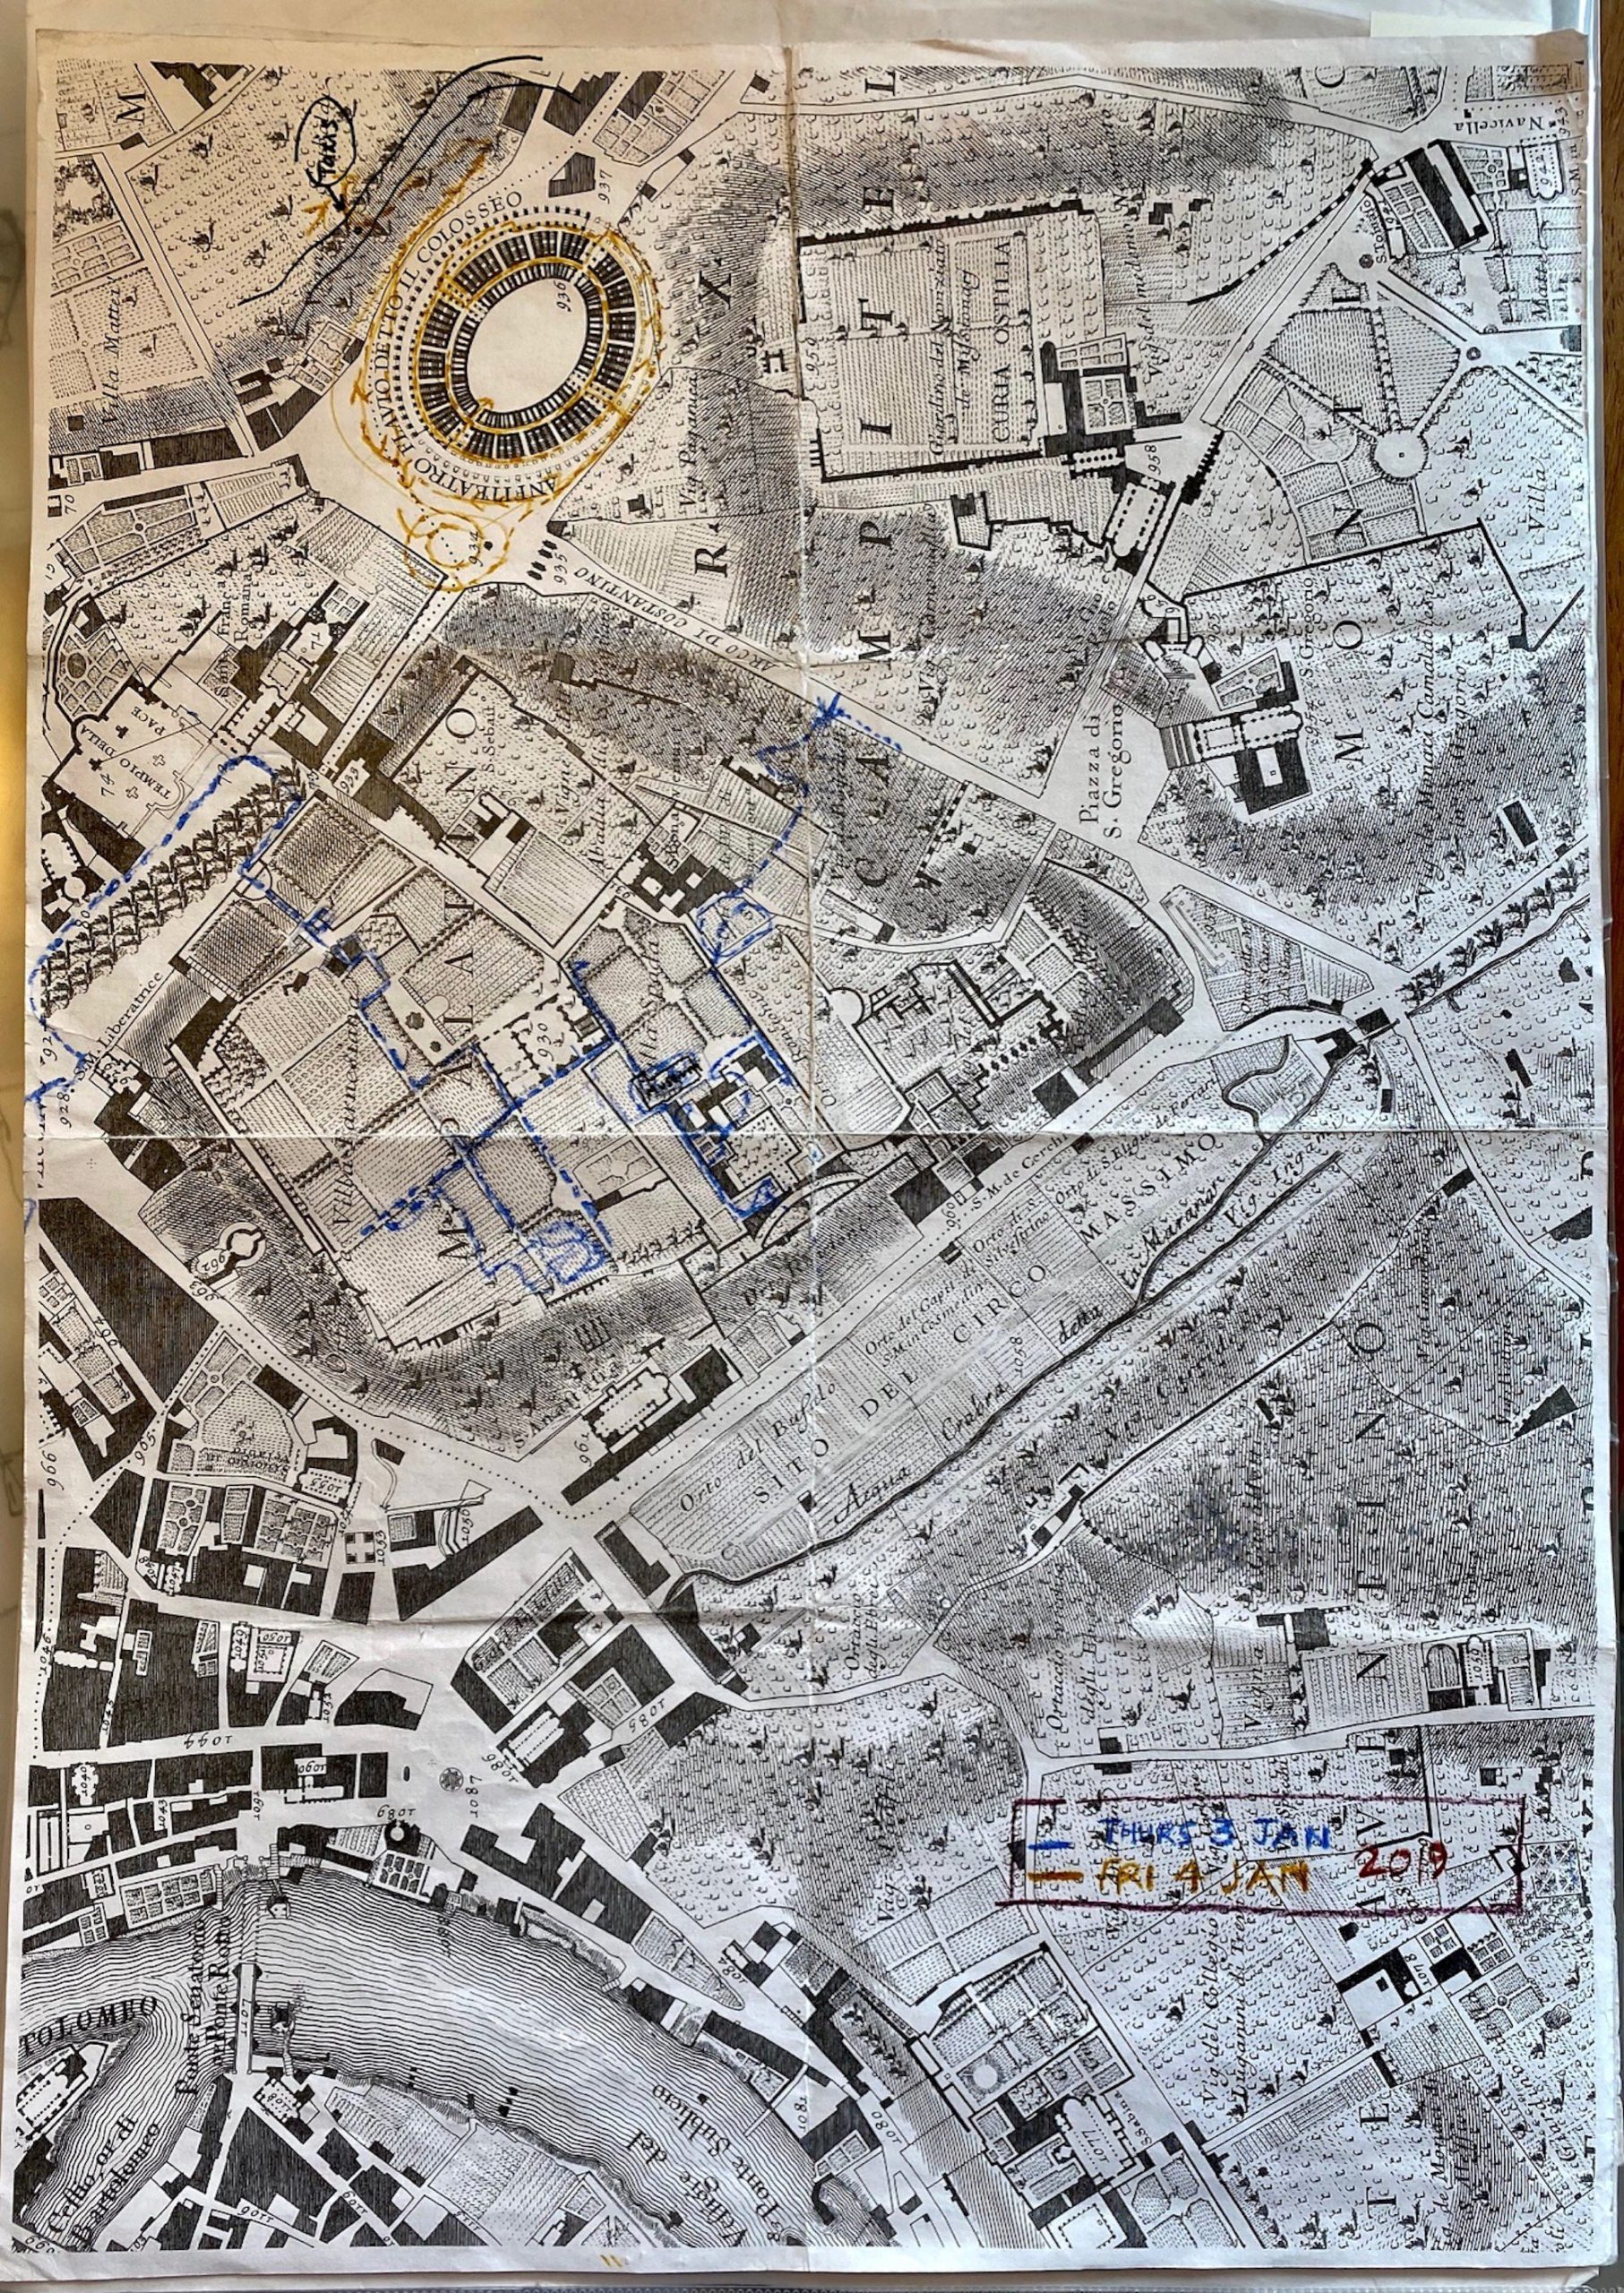
Every January, when John and I visit Rome, I bring a set of A3 photocopies of the Nolli plan (Giambattista Nolli’s Nuova Topografia di Roma, 1748). I don’t bring the whole map – it stretches to twelve sheets, each about A2 in size – so before arriving I am already editing my sense of the city. Always, though, I include the areas from Piazza del Popolo to the Campidoglio and Trastevere, and then each year there are other areas we’ve decided to visit, maybe Caracalla and the Aurelian walls or the Colosseum and Domus Aurea.
Each day I mark the routes of my walks through the city on the map using a different coloured pencil. These visits usually last five days, which works well for this technique: five is about as many distinguishable colours I can find, and even five lines drawn on the same little street or piazza, or inside the Pantheon, tend to get muddied and indistinguishable. But, of course, that is part of the process and the intention. It’s not really a record to be examined or analysed; it’s a graphic representation of an experience, as well as being part of the experience.
The five colours interweaving between the columns of the portico of the Pantheon make a kind of woven fabric of their own and they vibrate with an intensity. They hold and evoke memories: lunches, dinners, good bars for a late-night grappa, are all recorded. Which means that now, locked-down with no prospect of travel I can visit my own Rome. I can draw on my annual records of those visits overlaid on Nolli’s closely woven urban plan, the coloured lines like strings winding through the city bring back rambling conversations.
Inevitably the Campus Martius sheet is the most marked and the most worn out. It bears scars and lines from being repeatedly folded and unfolded and pulled in and out of my pocket. Other sheets have just one thread of colour looping in from the edge, or appearing out of nowhere when I’ve taken a bus or taxi to get there. Because only routes that I’ve walked are recorded.
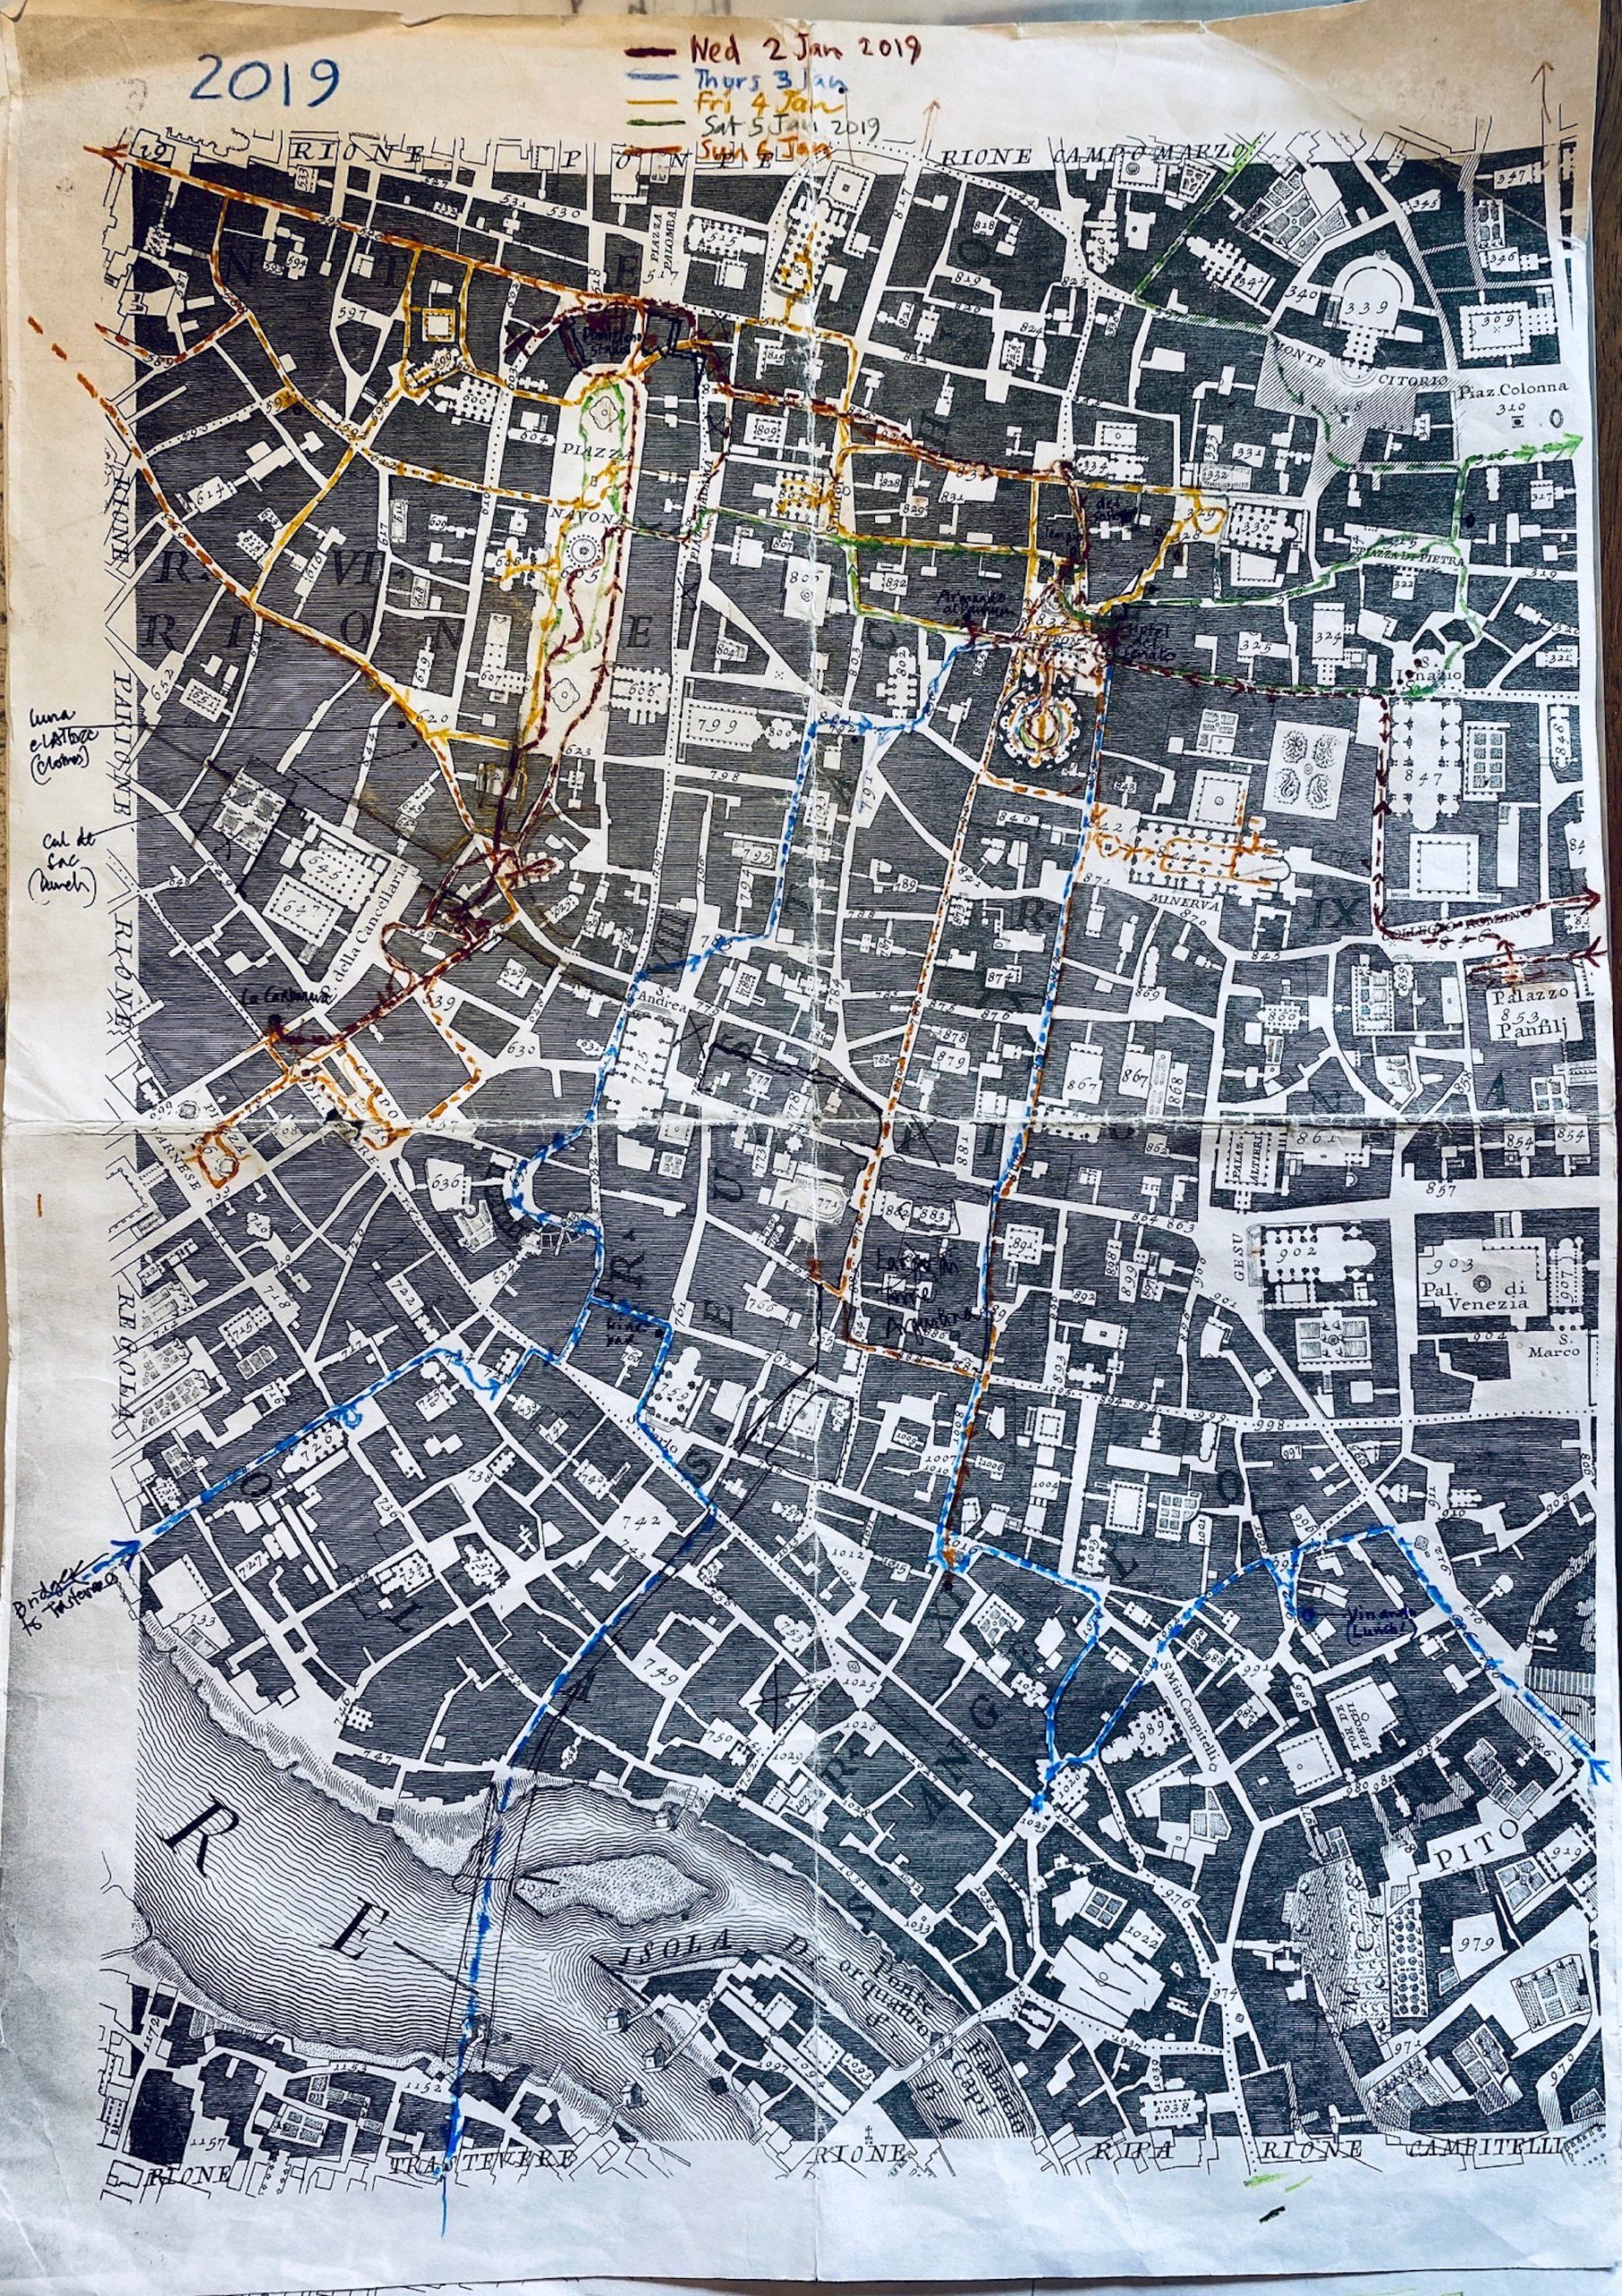
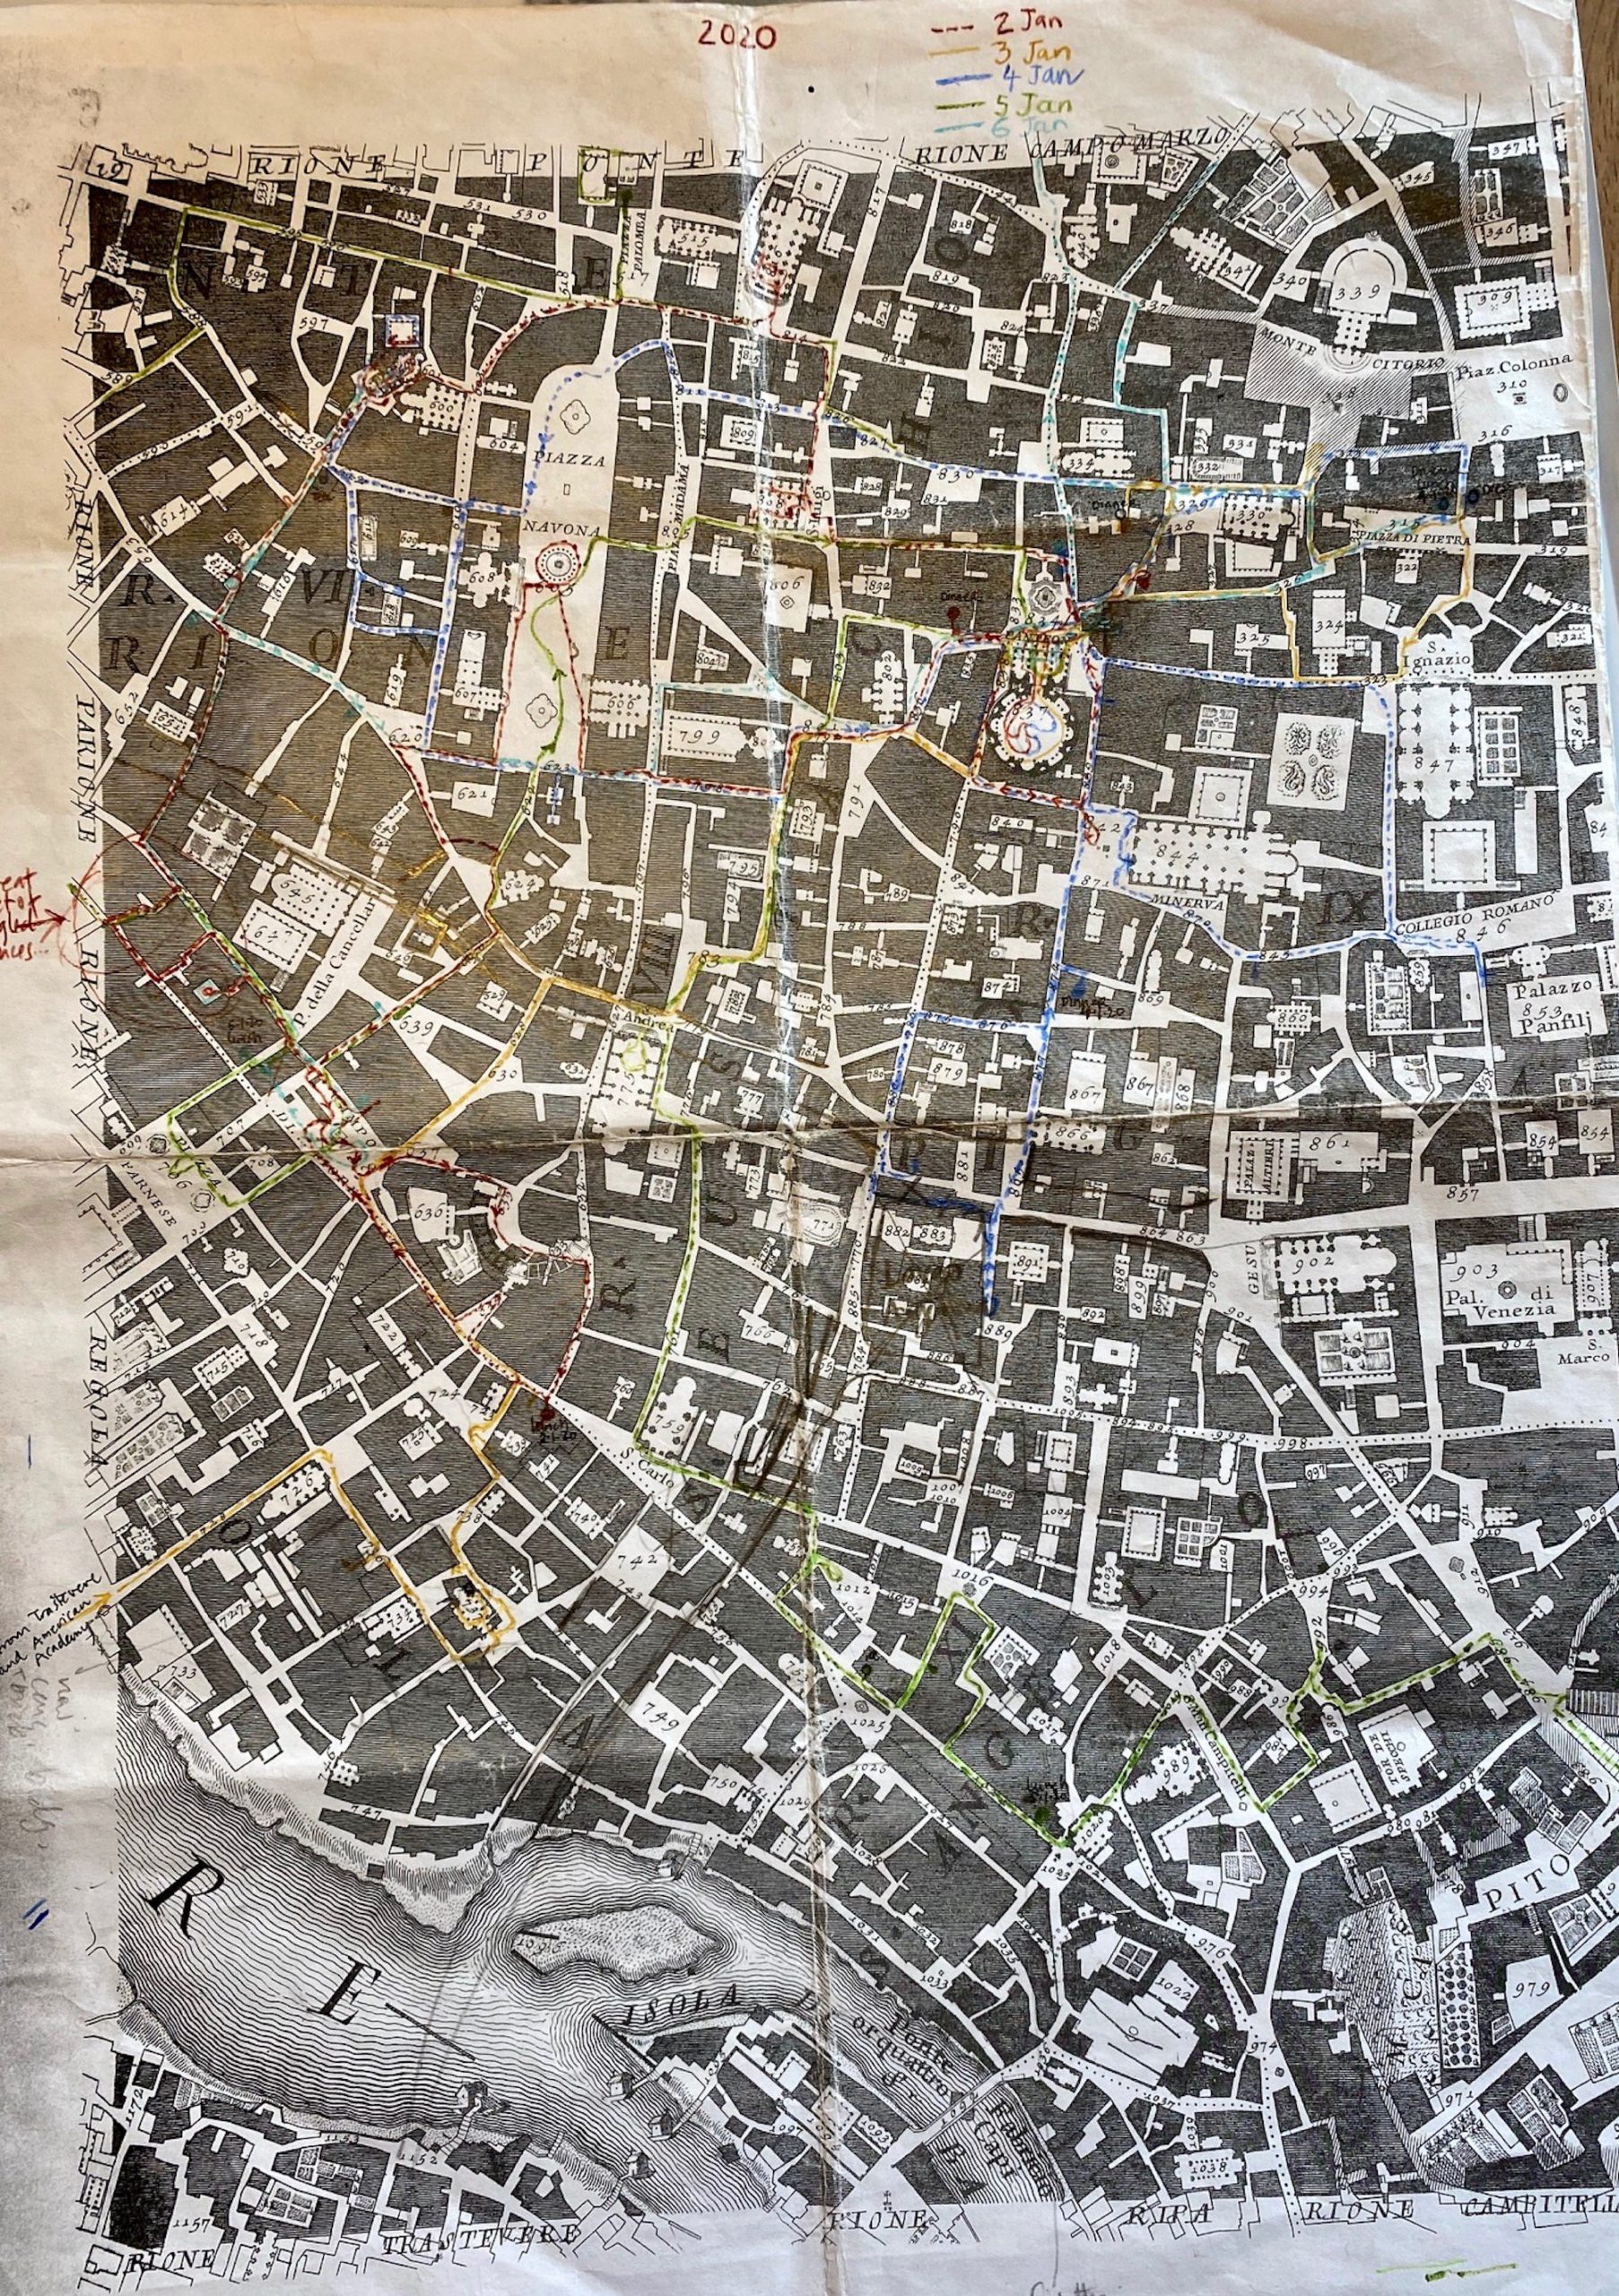
Why do I do this? For me this map has a physical presence; it describes the city as I experience it and it affects how I experience it. It makes me stop and look. It sends me into places I wouldn’t otherwise notice. One thing leads to another; I find myself in an interesting place and check it on the Nolli plan. It’s nearly always there or, if not, some trace of what Nolli drew is discernable in the present fabric. And inevitably beside it on the map is something else of interest; every little shift in the angle of a line, every bend and setback, represents a reality that he measured and that I can still experience today. In some quiet backwater I walk into a series of connected, subtly angled spaces, and there they are on the map, the angles barely discernable in plan, but strongly experienced in reality.
This is also a lesson in the making of space, in how little a wall needs to shift in plan to have a significant effect in space. And then as the coloured lines build up over the days they become part of my Nolli plan. I start to own this map. The object changes from a photocopy of an old map to a visual diary of sorts. By day four I’m using the drawn-over map as a way of planning the next day’s wandering; why is there a corner of the map I haven’t explored?
It’s also a kind of detective’s tool. In trying to work out where exactly the line of the Corso Vittorio Emanuele cut through Rome in the late-nineteenth century, the surviving churches and palazzos accurately drawn by Nolli allow me to join the dots and to work out, for example, that they added a layer to the north side of Palazzo Barracco (now a lovely small museum) to make a facade to the new street.
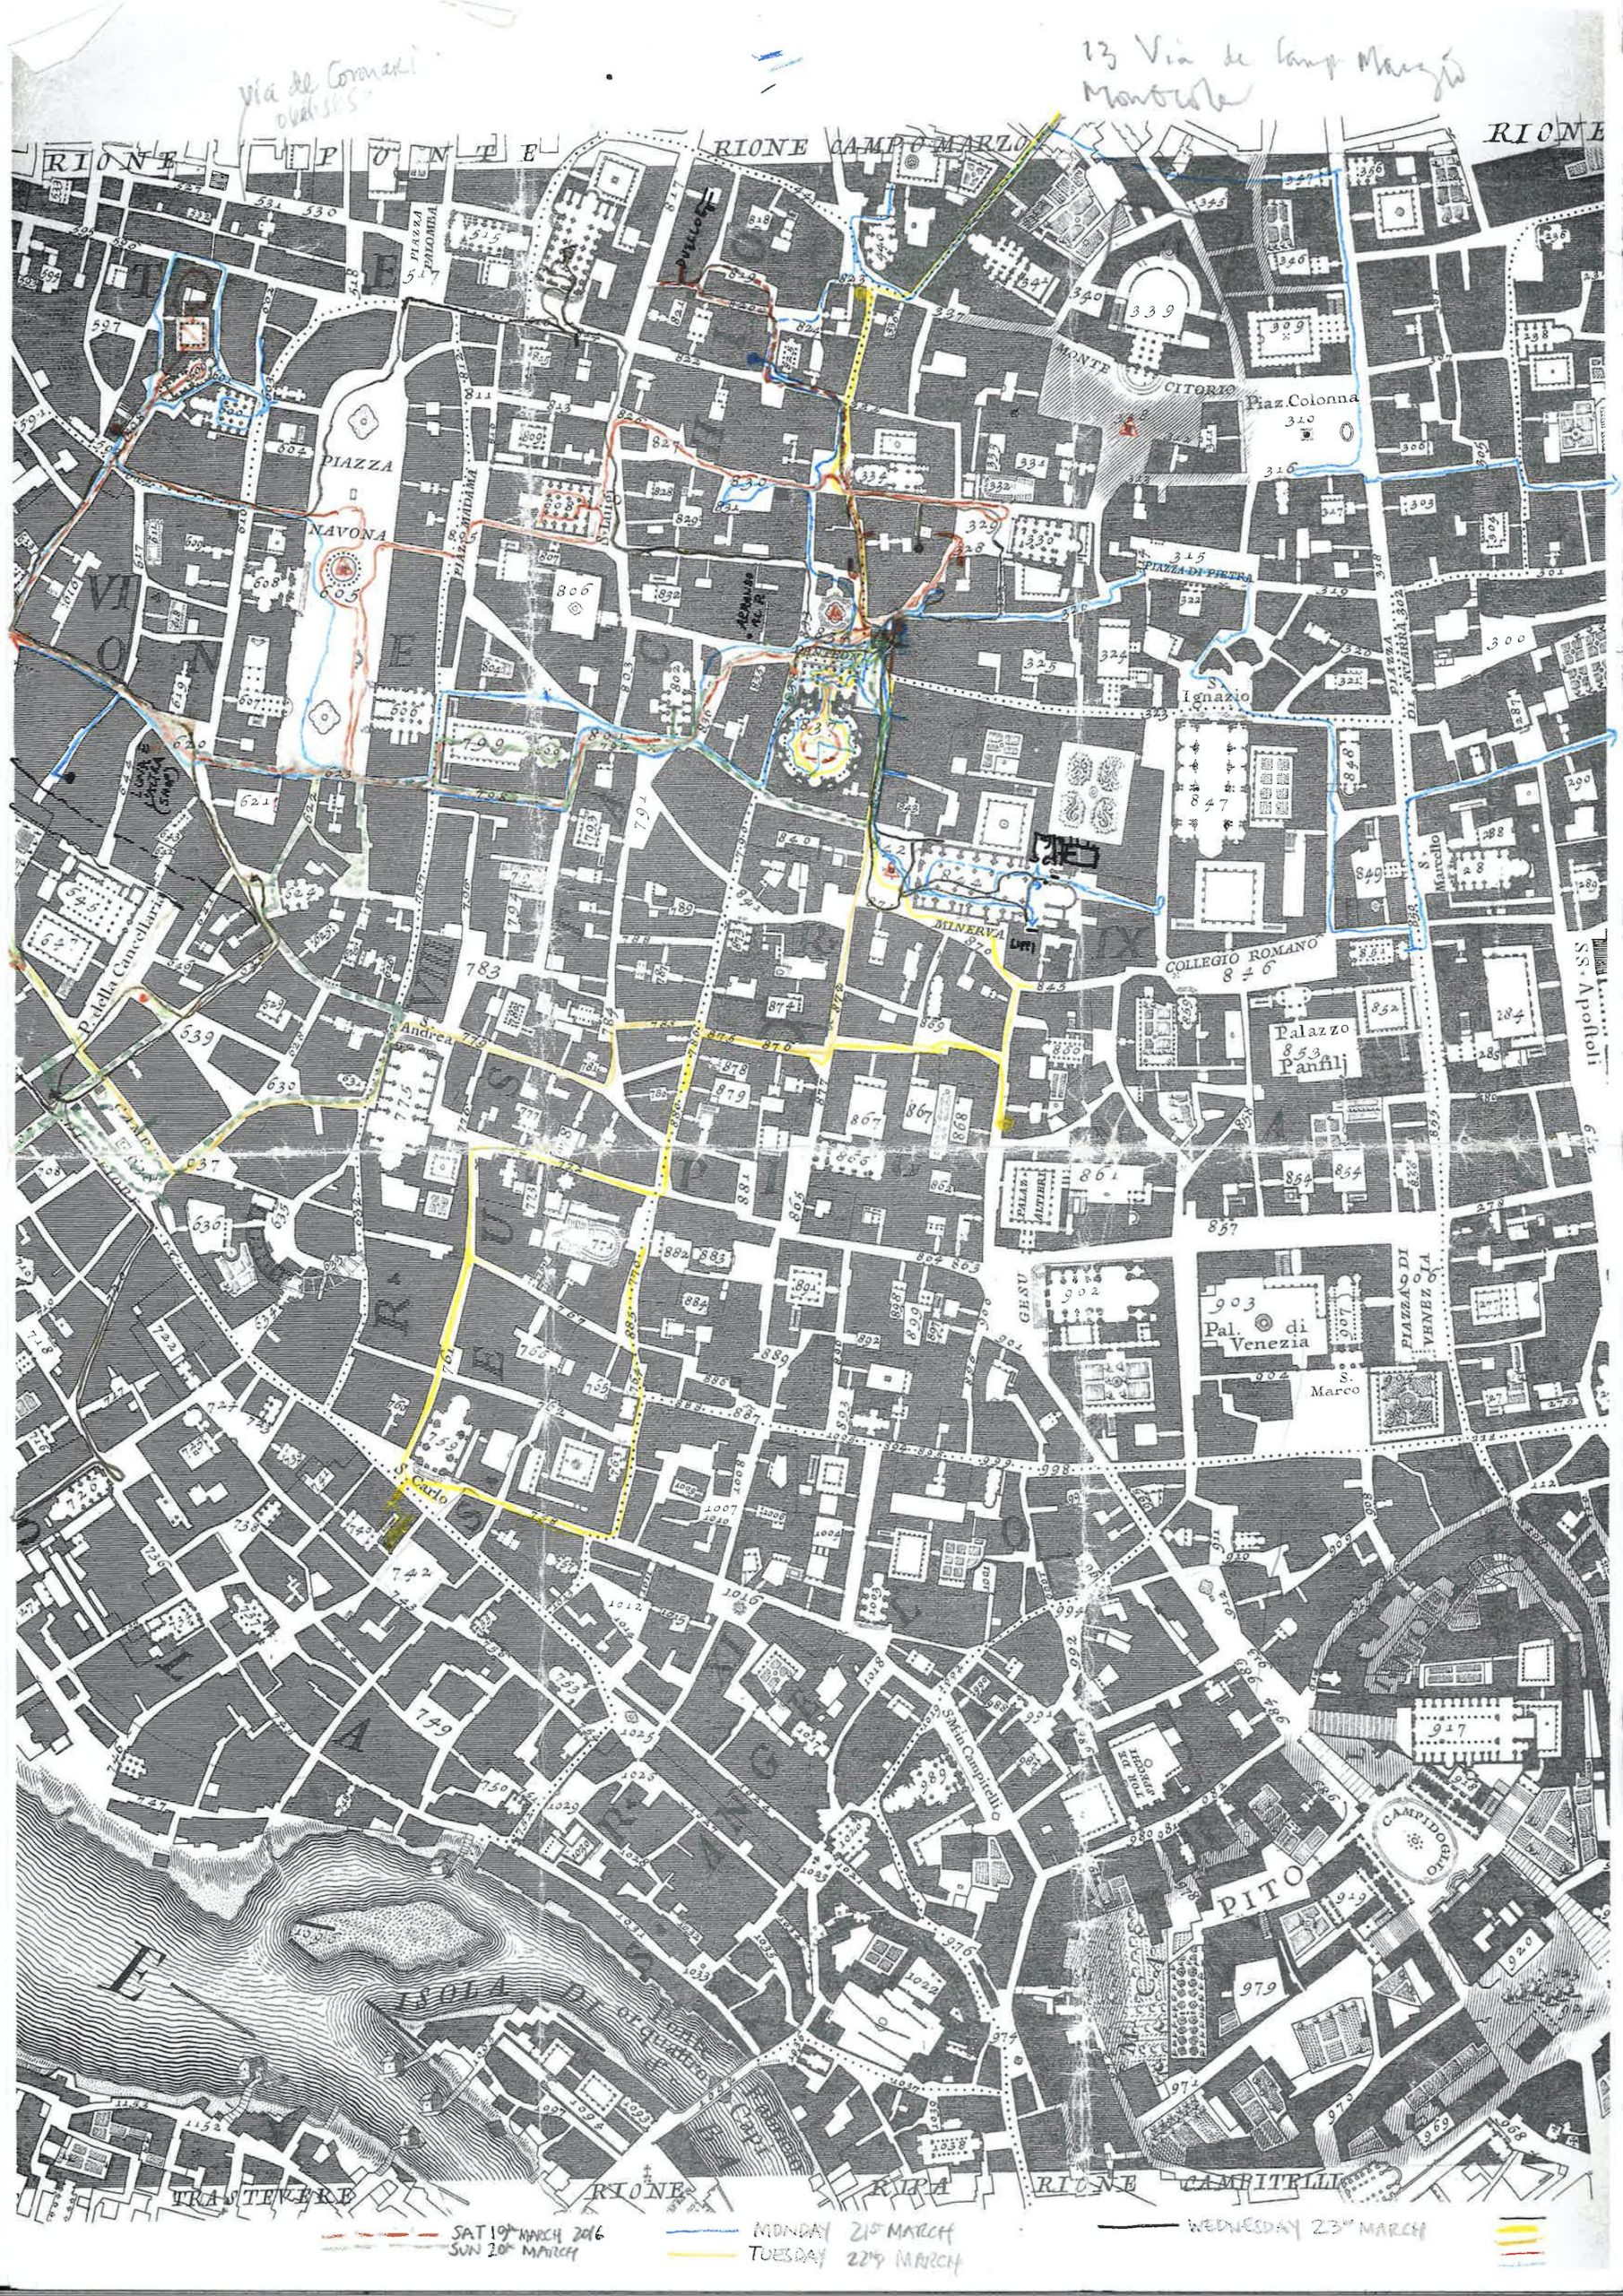
Nolli represented the city he measured as a continuous physical entity, distinguishing between public and private but not between old and new – other than a subtle difference in tone for ancient structures. He was not interested in showing chronology, which would inevitably have made the map more diagrammatic and less informative to my eyes. Because the more coded (by colour or hatches) a map is, the more it separates the information into discrete fields. I’ve read some criticisms of this, suggesting that, by failing to represent more layers of age, his map is simplistic and rejects the most progressive scholarship of his day, but I choose to read this as a positive intention. He wanted to describe and represent the city as he saw it and experienced it: a continuous built reality. This feels like an architect’s way.
Nolli’s was the first really detailed, carefully surveyed, accurately scaled plan map of Rome. Many good earlier maps were three-dimensional, perspective views. These tended to emphasise the monuments and important landmarks and not to show the background fabric. And, of course, they were directional, seen from a viewpoint selected by the mapmaker, so that every building shown blocked out whatever was just behind it. Paradoxically, then, Nolli’s map is a more spatial and three-dimensional representation of the urban fabric of Rome. He places the monuments in the context of the dense fabric of the city, correctly records their scale and shows the spaces they do or don’t carve out around them.
The few obvious mistakes – everyone points to his misalignment of the Theatre of Pompey – just make the accuracy of the whole all the more impressive. This document endures as an accurate representation of Rome, and Rome endures as the city Nolli measured in the 1700s. I am walking in his footsteps.
Notes
When I got back from Rome this year, I discovered that there’s an interactive Nolli App available for smartphones which overlays today’s satellite on Nolli’s map. By sliding a scale, you can move from one to the other, making Nolli hover over the contemporary map. It’s amazing; you can see exactly what’s changed, how new routes relate to the old plan, where old courtyards and lanes survive in reworked buildings. You can see how accurate Nolli was. I wondered if this made my efforts redundant, but using the App made me realise more clearly what it is I am doing. It’s the opposite of hovering. Each year I make a new finite document which stakes out my Rome as a thing in itself: by acting on the map, I claim the city.
